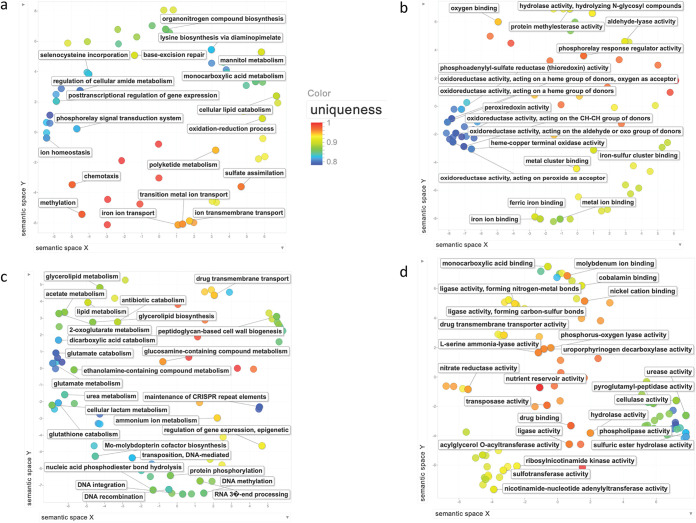
FIG 2.
MAP enriched and underrepresented GO terms compared to Mtb, summarized and visualized as a REVIGO scatterplot. (a) Enriched Biological Process; (b) enriched Molecular Function; (c) underrepresented Biological Process; (d) underrepresented Molecular Function. Each circle represents a cluster of related GO terms, with a single term chosen by REVIGO as the cluster representative. Clusters are plotted according to semantic similarities to other GO terms (adjoining circles are most closely related). We have arbitrarily chosen to label a number of circles with their respective GO term in an attempt to reflect the overall range and emphasis. “Uniqueness” (the negative of average similarity of a term to all other terms) measures the degree to which the term is an outlier compared semantically to the whole list; blue and turquoise dots are among the least unique and, therefore, are of greatest average similarity to the set as a whole.

