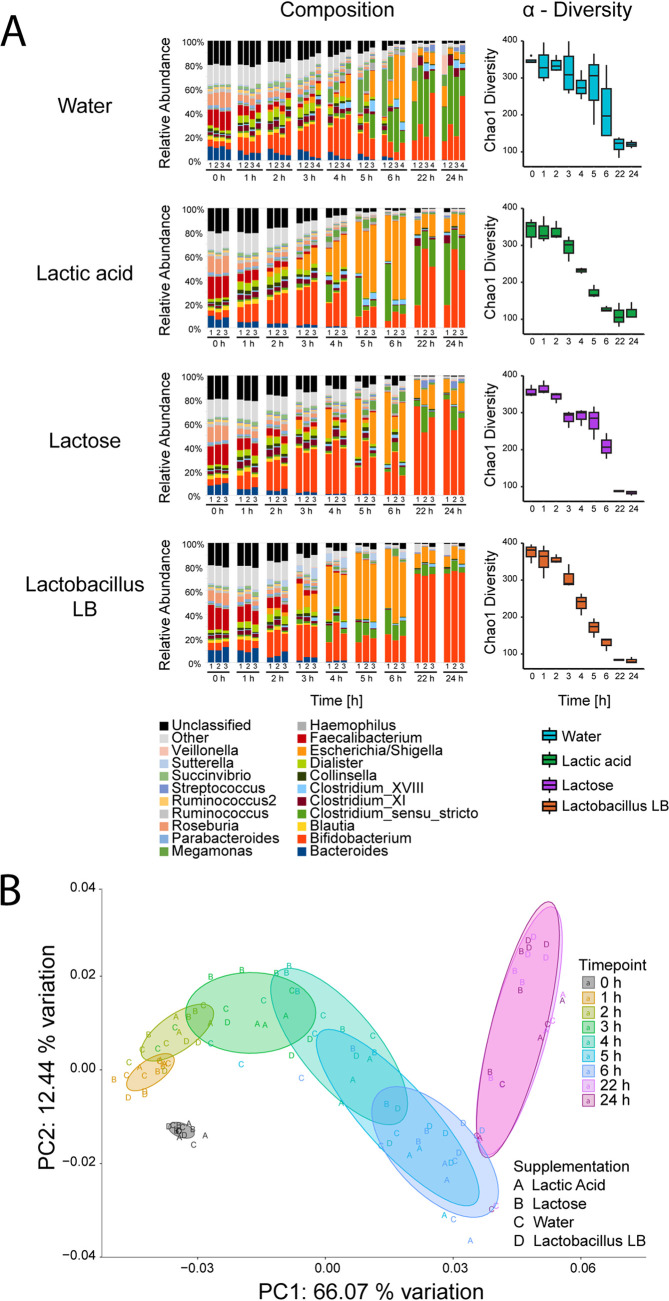
FIG 1.
Microbiome analysis during the 24-h fecal fermentation. Vessels were supplemented with water, lactic acid, lactose, or Lactobacillus LB. Samples were collected at the start (0 h) and after 1, 2, 3, 4, 5, 6, 22, and 24 h of fermentation. (A) Composition and α-diversity changes. Left, composition changes at genus level. Each bar represents a sample. The experiment was performed in triplicate (1 to 3) or quadruplicate (1 to 4). For simplicity, all genera with average abundances below 1% were grouped. Right, α-diversity changes measured by Chao1 index. Each bar represents the average for samples taken at each time point. (B) β-Diversity of changes over the 24-h fecal fermentation. Each letter represents sample taken at the start (0; gray) and after 1 (yellow), 2 (light green), 3 (green), 4 (marine), 5 (light blue), 6 (dark blue), 22 (light purple), and 24 (dark purple) h of fermentation. Vessels were supplemented with lactic acid (A), lactose (B), water (C), or Lactobacillus LB (D). The experiment was performed at least in triplicate. Data represent weighted UniFrac values.

