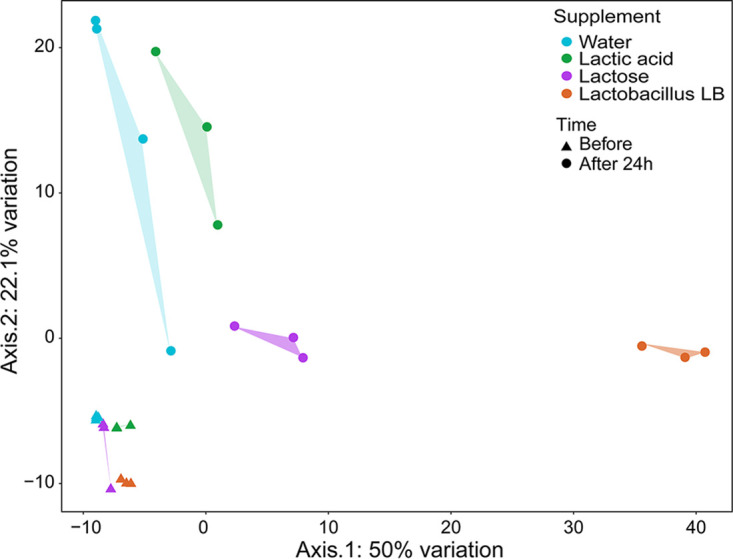
FIG 3.

PCoA plot representing metabolic profiles based on the Euclidian distances of samples at the start (triangle) and after (circle) 24-h fecal fermentation in vessels supplemented with water (blue), lactic acid (green), lactose (purple), or Lactobacillus LB (orange). The graph was prepared based on the nonnormalized relative concentrations of the variables in reduced data sets for SCFA (6 compounds) and other metabolites (178 compounds).
