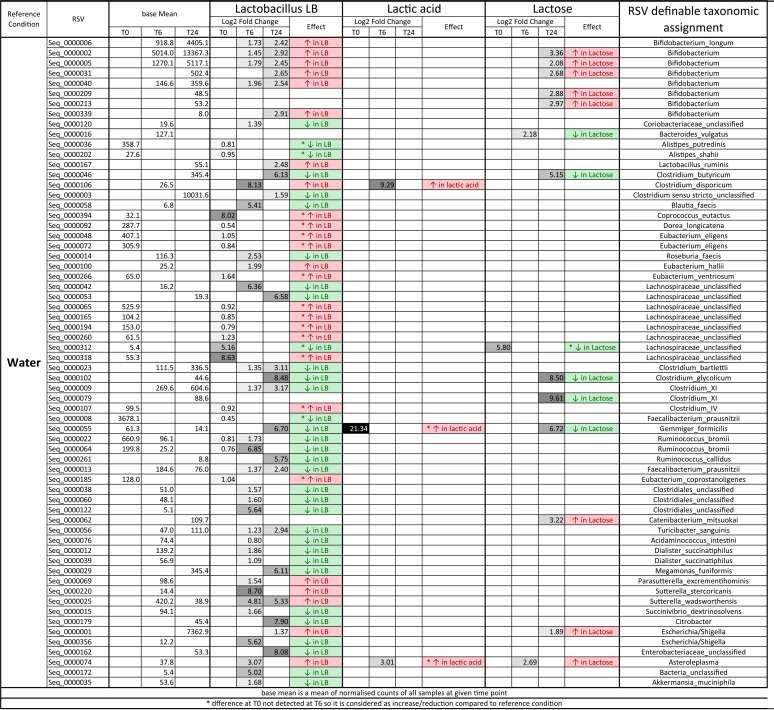
TABLE 1.
Abundance changes at the RSV level at the start of the experiment and after 6 and 24 h of fecal fermentationa
Green indicates a reduction in abundance and red indicates an increase in abundance compared to reference condition (water). *, difference at 0 h that was not detected at 6 h and, therefore, is considered increase/reduction compared to the reference condition. Greyscale shading indicates the extent of log2 fold change, with white indicating no change and black indicating maximum log2 fold change. Base mean indicates mean normalized counts of all samples. Statistical significance for adjusted P values was set at P < 0.05; base mean and log2 fold change values are presented only for statistically significant changes due to treatment and/or time (empty cells show nonsignificant comparisons). Complementary comparisons between vessels are presented in Table S6.

