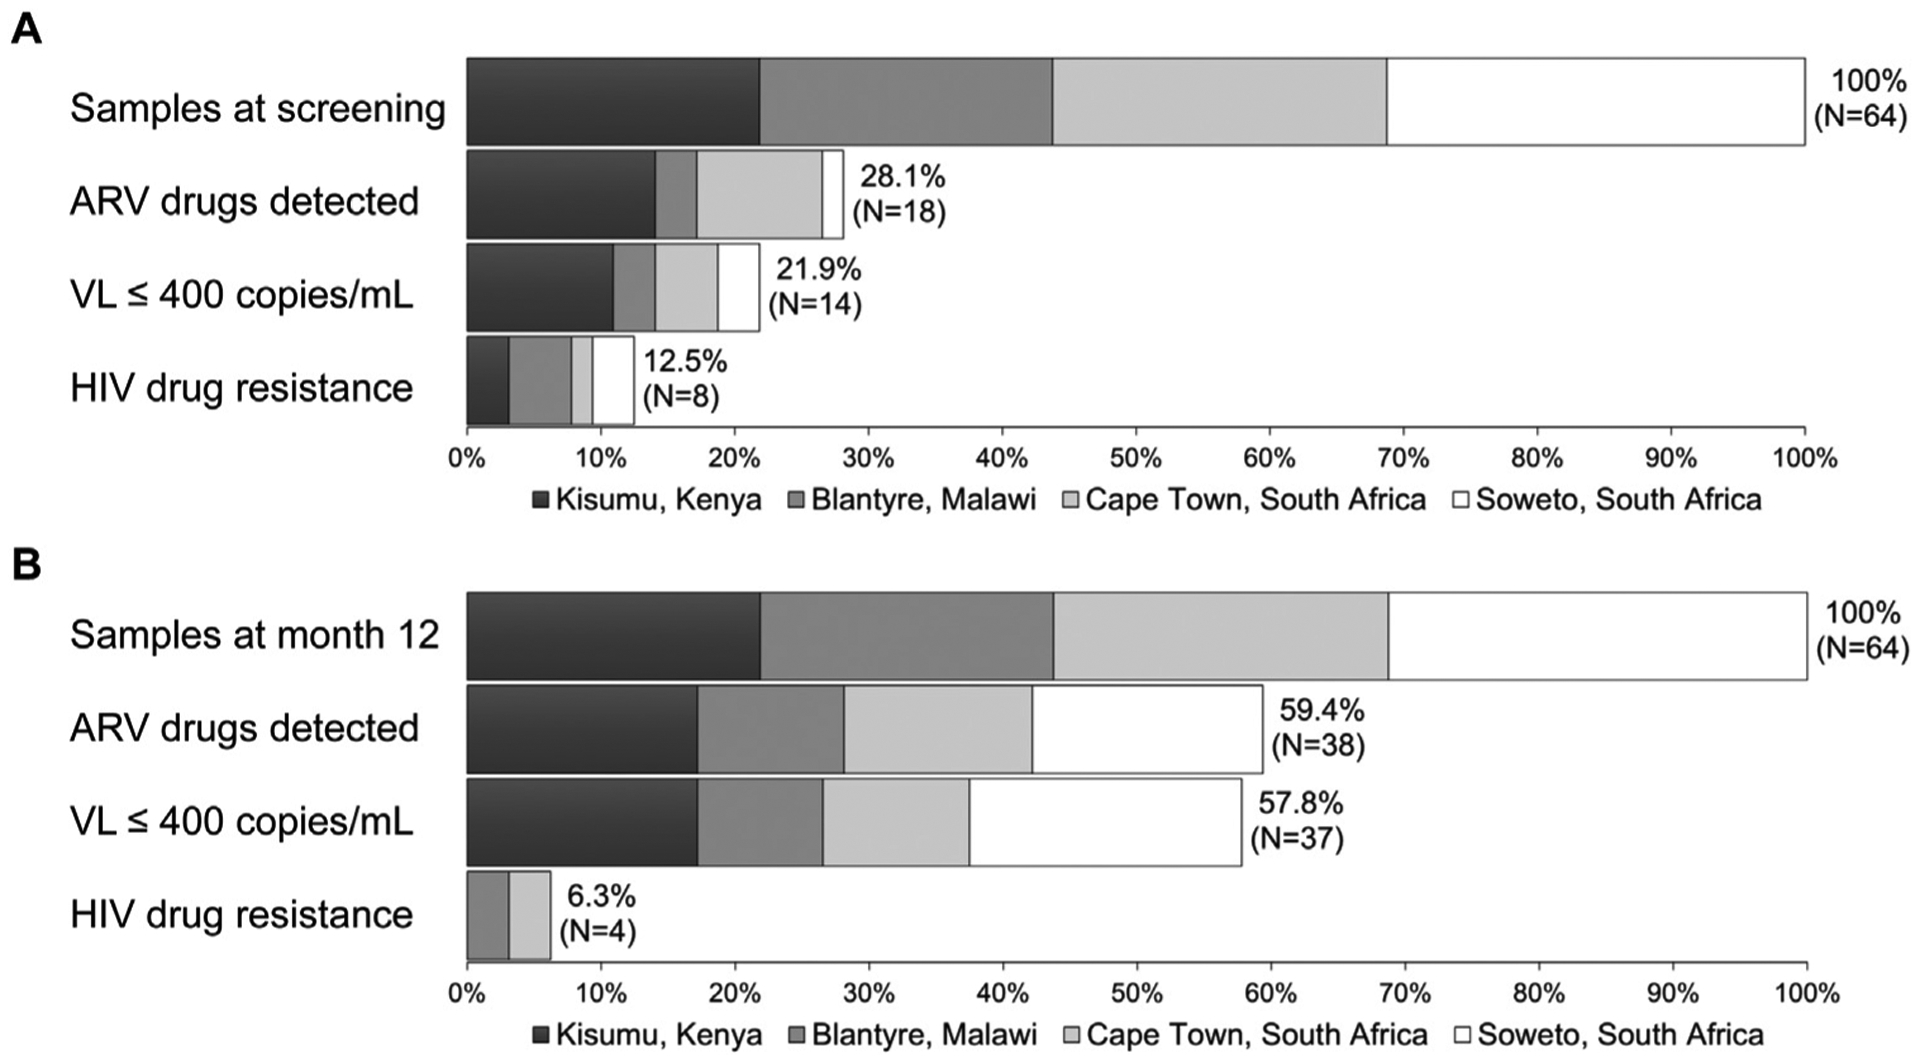
Figure 1. Proportion of participants with different study outcomes.

The panels show data for the 64 participants at screening (Panel A) and at month 12 (Panel B). HIV drug resistance testing was only performed for participants with viral loads >400 copies/mL. The proportion of participants with drug resistance in each group is shown for all participants; participants who were virally suppressed were classified as having no drug resistance. Abbreviations: ARV, antiretroviral; VL, viral load; and mL, milliliter.
