
Figure 1.
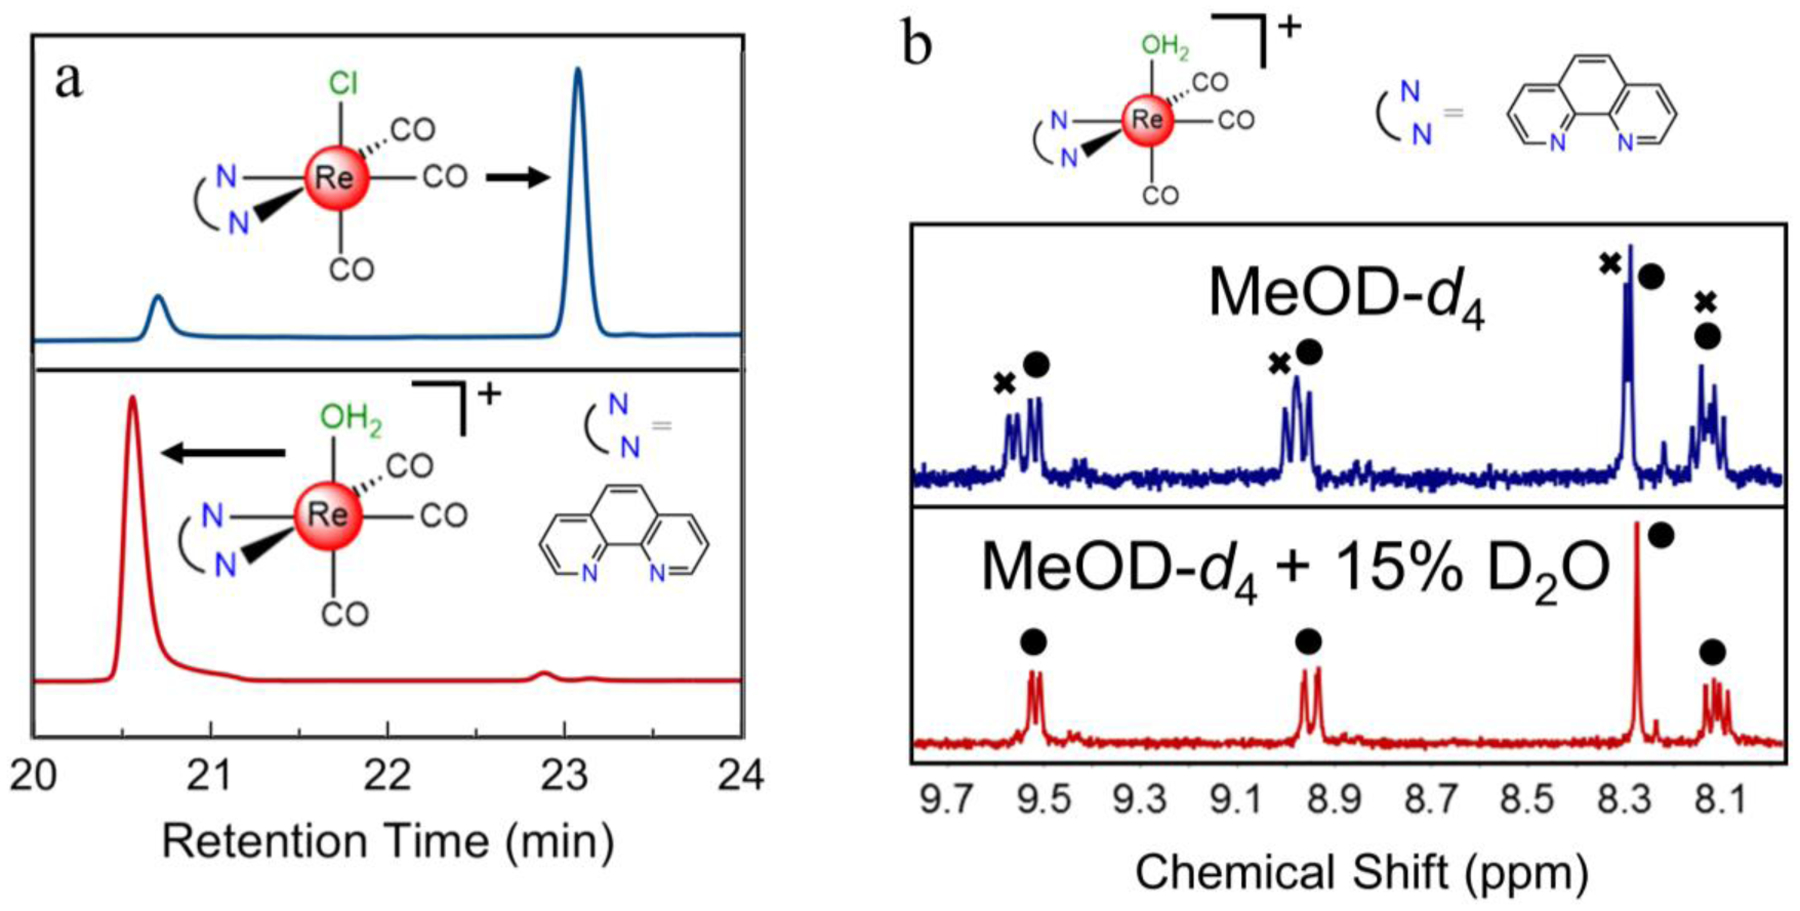
a) HPLC chromatogram of the phen chlorido species 5 (blue, top trace) and the corresponding aqua species 12 (red, bottom trace) using a methanol gradient elution and monitoring 260 nm. b) 1H NMR spectra of the phen aqua species 12 in MeOD-d4 (blue, top trace) and in MeOD-d4 with 15% D2O (red, bottom trace). The circles designate peaks due to the aqua complex and the x’s designate peaks due to the methanol adduct.