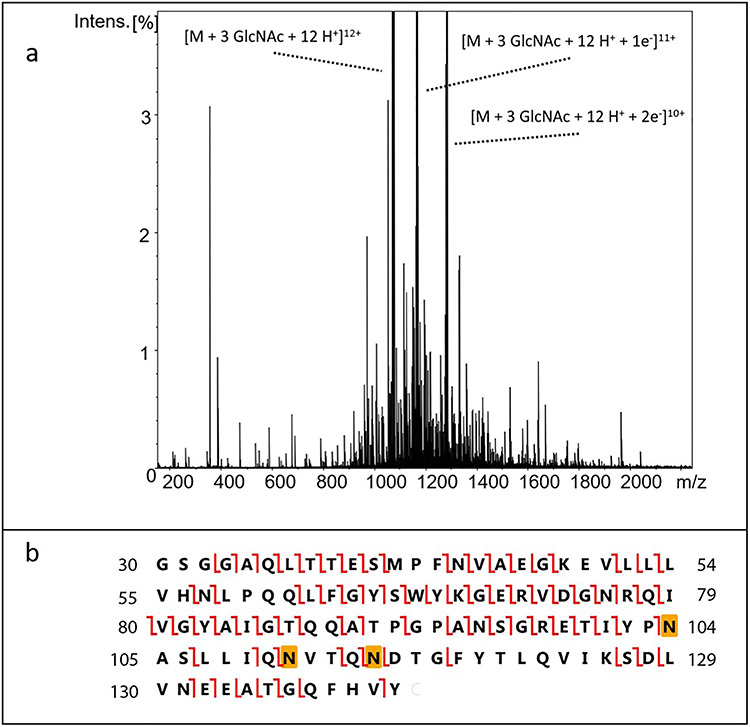
Fig. 5.

Top–down ECD MS2 determination of glycan occupancy. (A) Example of the ECD MS2 spectrum of the proteoform having three GlcNAcs. The vertical scale was chosen to emphasize the large number of low-intensity fragment ions. Three intense peaks corresponding to the precursor ion and two charge-reduced ions are observed. (B) Construct sequence showing observed c and z fragment ions. The highlighted Asn residues indicate the glycosylation sites.
