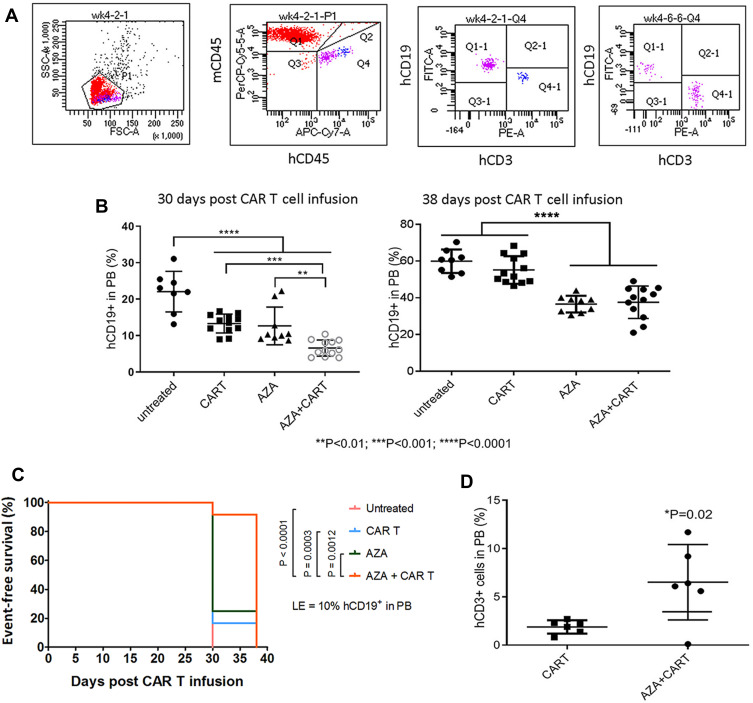
Figure 2.
Host priming with AZA reduced leukemia cell growth and promoted CAR T cell expansion in low leukemia burden model. Mice were transplanted with CD19+ ALL-2 cells and randomized in 4 groups: untreated (n = 8), mice treated with CAR T cells alone on day 8 (CAR T, n = 12), mice treated with AZA (2.5 mg/kg) on day 7 (AZA, n = 9), mice treated with AZA on day 7 and then infused with CAR T cells on day 8 (AZA + CAR T, n = 12). (A) Flow cytometry analysis of CD19+ leukemia and CD3+ CAR T cells from PB of mice. Live cells were gated based on FSC/SSC fluorescence (P1 gate, left panel). Mouse CD45+ (mCD45+) and human CD45+ (hCD45+) cells were analyzed in the P1 gate (second left panel). Human (hCD19+) and human CD3+ (hCD3+) cells were identified in the hCD45+ Q4 gate (second and first right panels). One representative dot plot is shown. (B) hCD19+ leukemia cell engraftment in PB measured at days 30 and 38 post CAR T cell infusion (left and right panels, respectively). (C) Kaplan-Meier survival analysis showing significant differences in event-free survival (EFS) between untreated and CAR T and/or AZA-treated groups. (D) CD3+ T cells identified in PB of 6/12 mice from CAR T and AZA + CAR T groups at day 30, with each dot plot representing the analysis of individual mice from CAR T and AZA + CAR T groups.

