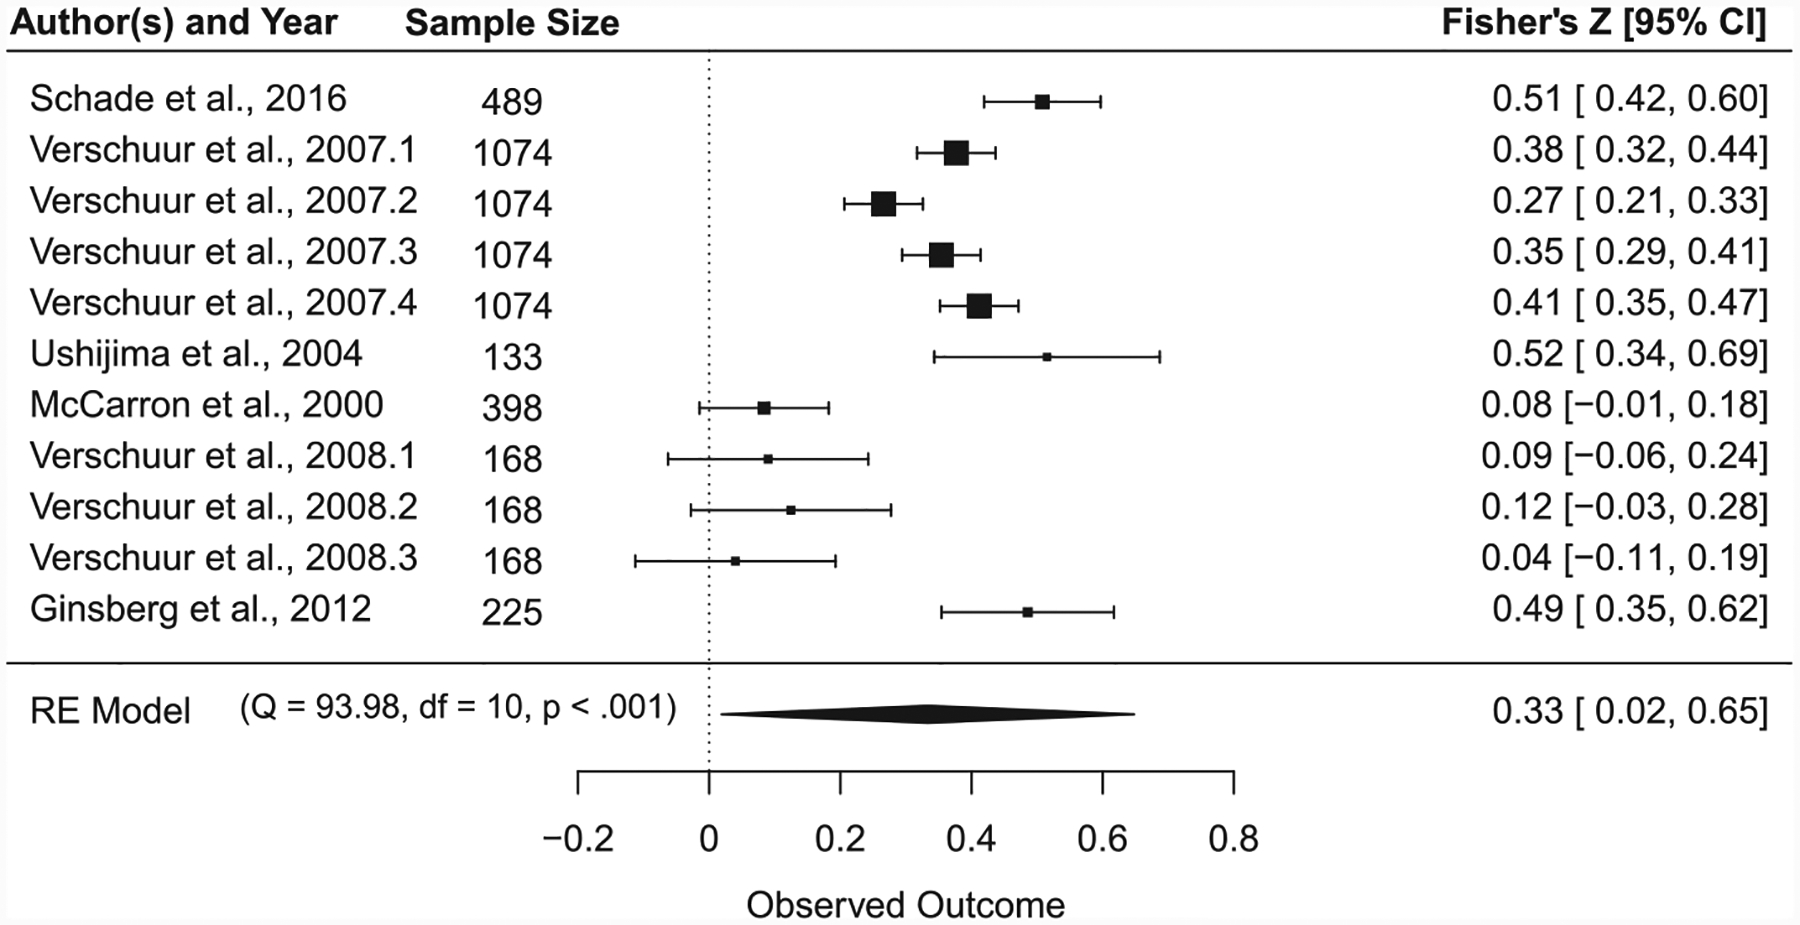
Fig. 2.

Effect size forest plot for meta-analysis of the effect of contamination-related health concerns on all psychological health dependent variables. Note. Each individual Fisher’s z effect size is presented as a black square with 95% CI error bars. Size of the square for each individual effect size represents relative weight based on sample size. The large black rhombus represents the aggregated Fisher’s z effect size. The width of the rhombus represents the 95% CI around the effect size.
