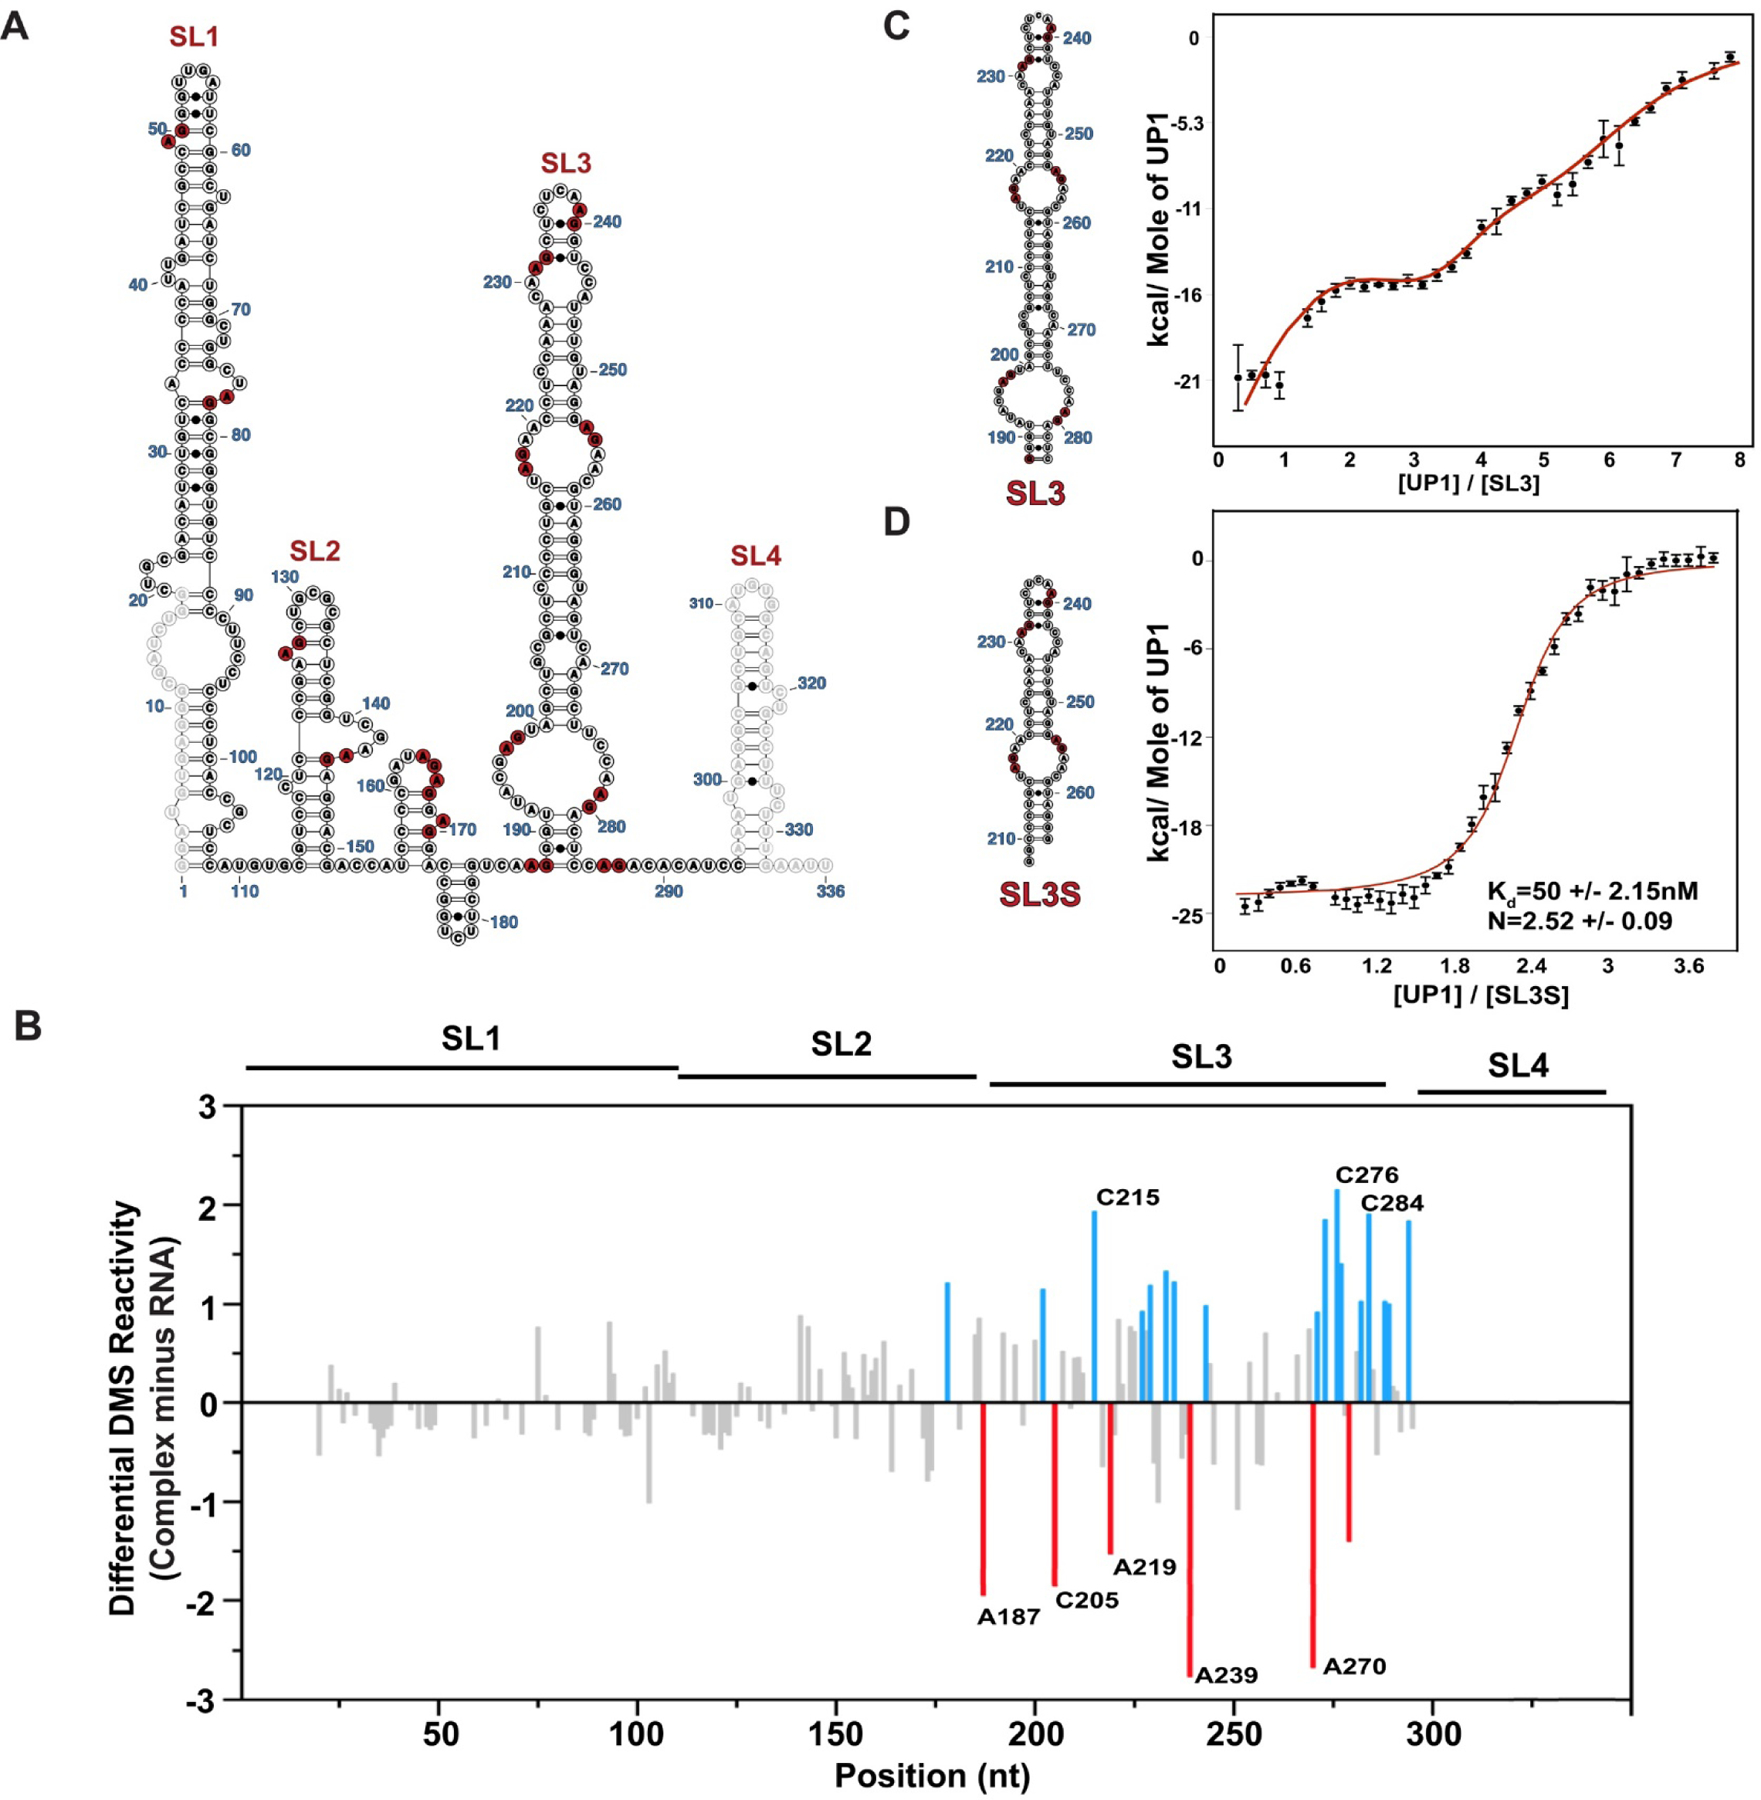
Figure 3. HnRNP A1/A2 Proteins Bind Selectively to Stem Loop 3 of 7SK snRNA as Revealed by Differential DMS-MaPseq.

(A) The population average secondary structure of 7SK snRNA with 14 partially single strand high affinity (5’-R/YAG-3’) hnRNP A1/A2 consensus binding motifs depicted in red. (B) The differential DMS-MaPseq signal calculated by subtracting reactivity indices of free 7SK snRNA (100 nM) from that of the UP1–7SK complex with 25 fold excess of UP1 (2.5 μM). Delta indices above and below zero correspond to sites that become more and less reactive, respectively within the complex. The blue and red bars show the delta DMS reactivity indices larger than one standard deviation from the average. Calorimetric titration isotherms of UP1 titrated into (C) SL3 and (D) SL3S ITC data were collected in the buffer condition of 10mM K2HPO4,120mM KCl, 0.5mM EDTA, 1mM TCEP pH 6.5, at 25 °C. The red curves in the ITC isotherms fit to an independent sets of site model as in panel C or a single-site model as in panel D. Error bars on individual data points are automatically calculated in AFFINI meter and correspond to the uncertainty associated to the integral calculation of each peak, including the noise in the baseline and noise in the peak
