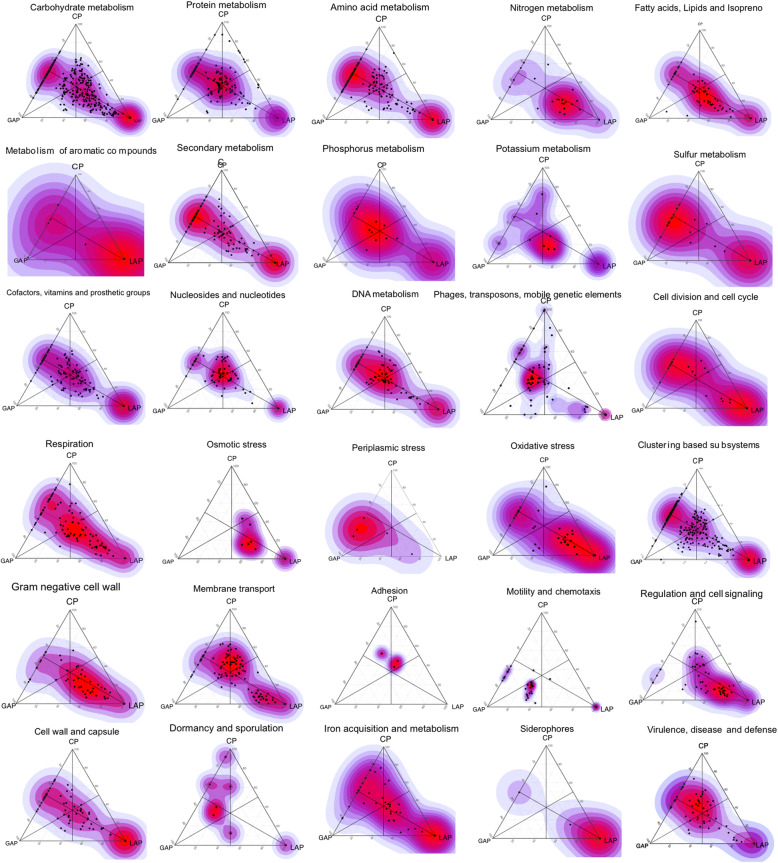
Fig. 5.
Disease-specific functional indicators. Barycentric plots of significantly different virulence functions in the three groups (p < 0.05, FDR adjusted Wald test) are shown. Each dot represents a gene. The three groups generalized aggressive periodontitis, chronic periodontitis, and localized aggressive periodontitis (GAP, CP, and GAP) are used as vertices. Within each plot, the coordinates of each gene are determined by the weighted average of the coordinates of all genes, and the weights are given by the relative abundance of the gene in that group (LAP, GAP, and CP). Data supporting this figure can be found in Supplemental Table 3

