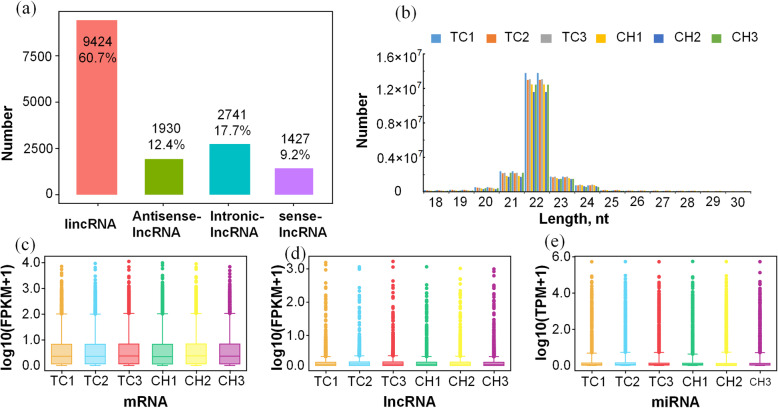
Fig. 1.
Comparison of the features of RNAs in the chorioallantoic membrane of chicken embryos. (a) Statistics of long non-coding RNA, including intergenic non-coding RNAs (lincRNAs), anti-sense lncRNAs, intronic lncRNAs, and sense lncRNAs; (b) Length distribution of 1439 miRNAs; (c) Distribution of mRNA expression values (FPKM) of six samples; (d) Distribution of lncRNA expression values (FPKM) of six samples; (e) Distribution of miRNA expression values (TPM) of six samples. The ordinate shows the log10(FPKM + 1) (c, d) and the log10(TPM + 1) (e) of each RNA from the six sets of RNA-seq data; the middle line in the box represents the median of FPKM/TPM. TC, Tibetan chicken; CH, Chahua chicken

