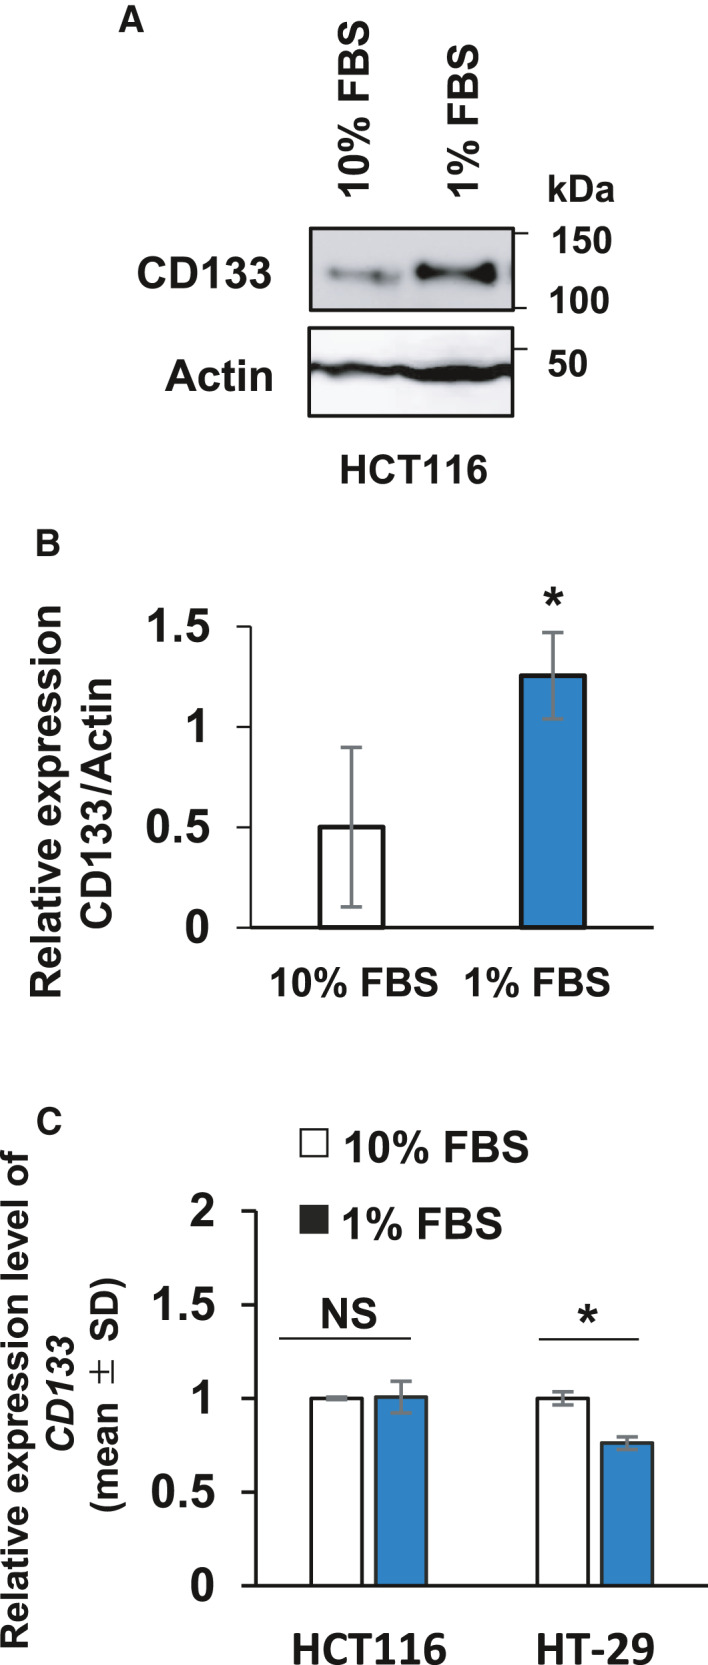
Fig. 5.

Up‐regulation of CD133 at the protein level following serum starvation. (A) Immunoblot analysis. HCT116 cells were cultured in medium containing 10% or 1% fetal bovine serum for 3 days. Cell lysates (30 µg per lane) were prepared and analyzed by immunoblotting with the indicated antibodies. Actin was used a loading control. (B) Relative band intensities of the phosphorylated proteins standardized with respect to total proteins were determined based on three independent experiments. Data represent the mean ± SD (n = 3) and asterisks indicate a statistically significant difference (P < 0.05, t‐test). (C) Real‐time RT‐PCR. Total RNA was extracted from the indicated cells cultured as in (A) and analyzed for CD133 by real‐time RT‐PCR. The CD133 level was normalized to the GAPDH level. Data represent the mean ± SD (n = 3) and asterisks indicate a statistically significant difference (P < 0.05, t‐test). NS, not significant.
