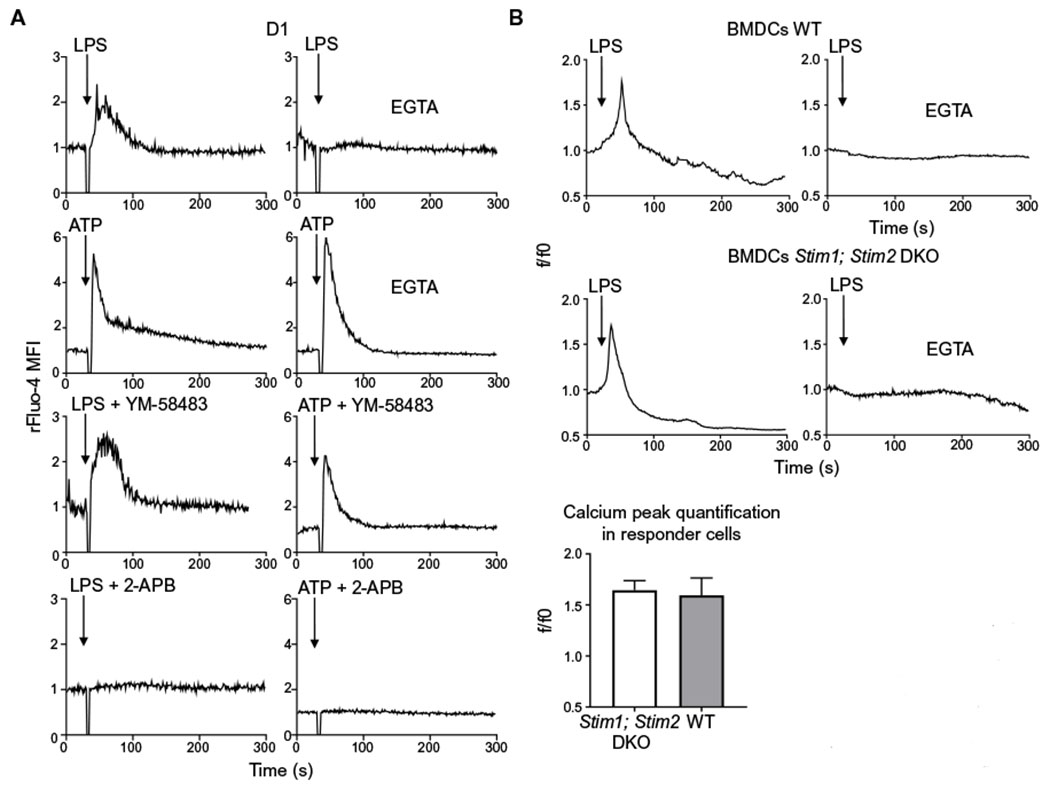
Fig. 1. Modalities of Ca2+ mobilization induced by LPS in DCs.

(A) Representative Ca2+ transients in mouse D1 cells treated with LPS or ATP in the presence or absence of the Ca2+ chelator EGTA, the CRAC inhibitor YM-58483, or the general ion channels inhibitor 2-APB. Arrows indicate the time (30 s) of LPS or ATP addition. Ca2+ fluctuations were evaluated by FACS on bulk populations as changes in Fluo-4 fluorescence in response to the stimuli and normalized to the value during the 30 s before LPS or ATP addition (rFluo-4 MFI). Traces are representative of three independent experiments. (B) Representative Ca2+ transients in wild-type (WT) and Stim1; Stim2 double-deficient mouse BMDCs. Ca2+ mobilization was measured by confocal microscopy in the presence or absence of EGTA. Arrows indicate the time (30 s) of LPS administration. Ca2+ fluctuations were evaluated as changes in Fluo-4 fluorescence in response to the stimuli and normalized over the first 30 s of analysis (f/f0). A minimum number of 100 cells in each group was analyzed. The quantification analysis shows the increase of fluorescence intensity in the peak interval for 25 responder cells. One experiment representative of two independent experiments is shown. DKO, double-knockout.
