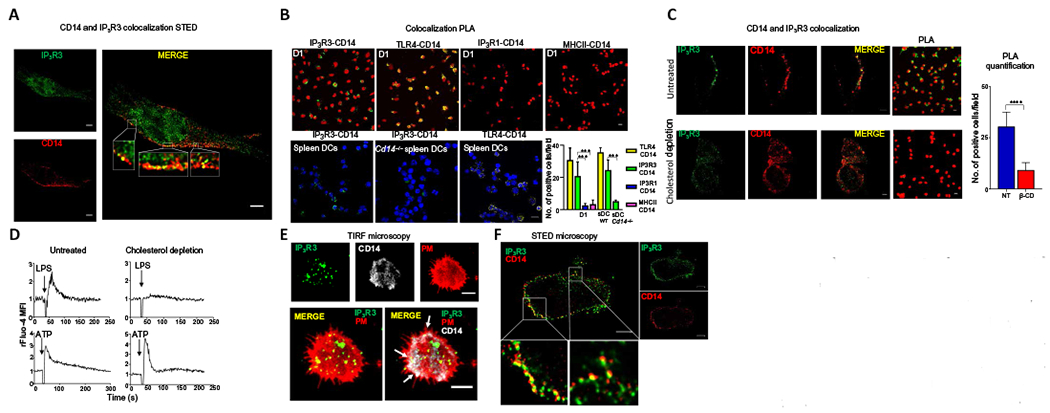
Fig. 4. IP3R3 and CD14 colocalize in lipid rafts at the plasma membrane in mouse and human DCs.

(A) STED microscopy showing localization of IP3R3 and CD14 in mouse D1 cells. Scale bars, 2 μm. Images are representative of three independent experiments. (B) PLA visualized by confocal microscopy for the indicated pairs of proteins in LPS-stimulated D1 cells or splenic DCs (sDCs) from WT or Cd14−/− mice. Sites of colocalization between CD14 and IP3R3 appear green. Sites of CD14 and TLR4 colocalization appear yellow (positive control). PLA between CD14 and IP3R1 (blue) and between CD14 and MHCII (pink) are negative controls. Nuclei are shown in red (top) or in blue (bottom). Scale bar, 10 μm. Images are representative of three independent experiments. Numbers of cells showing IP3R3-CD14, TLR4-CD14, IP3R1-CD14, and MHCII-CD14 colocalization were quantified. Statistical significance was determined with Sidak’s multiple comparisons test, ***P < 0.001, n = 10 fields of cells analyzed from three independent experiments. (C) Immunofluorescence and PLA showing IP3R3 (green) and CD14 (red) in untreated D1 cells and after lipid raft disruption by β-cyclodextrin (cholesterol depletion). Scale bars, 3 μm. Images are representative of three independent experiments. Numbers of cells showing IP3R3-CD14 colocalization in untreated (NT) or treated (β-CD) cells are also shown. Statistical significance was determined with unpaired Student’s t test, ****P < 0.0001, n = 8 fields of cells analyzed from three independent experiments. (D) Ca2+ transients in D1 cells after lipid raft disruption. Cells were treated (cholesterol depletion) or not (untreated) with β-cyclodextrin for 30 min before LPS activation. Arrows indicate the time of LPS or ATP (100 μM) administration. Ca2+ fluctuations were evaluated by FACS on the bulk population as changes in Fluo-4 fluorescence in response to the stimuli and normalized over the first 30 s of analysis (rFluo-4 MFI). Traces are representative of three independent experiments. (E) TIRF microscopy showing IP3R3 and CD14 in human CD1c+CD14+ cells. PM, plasma membrane (red). Scale bars, 2 μm. Images are representative of cells from five different donors. (F) STED microscopy showing IP3 R3 and CD14 in human CD1c+CD14+ cells. Scale bars, 2 μm. Images are representative of cells from three different donors.
