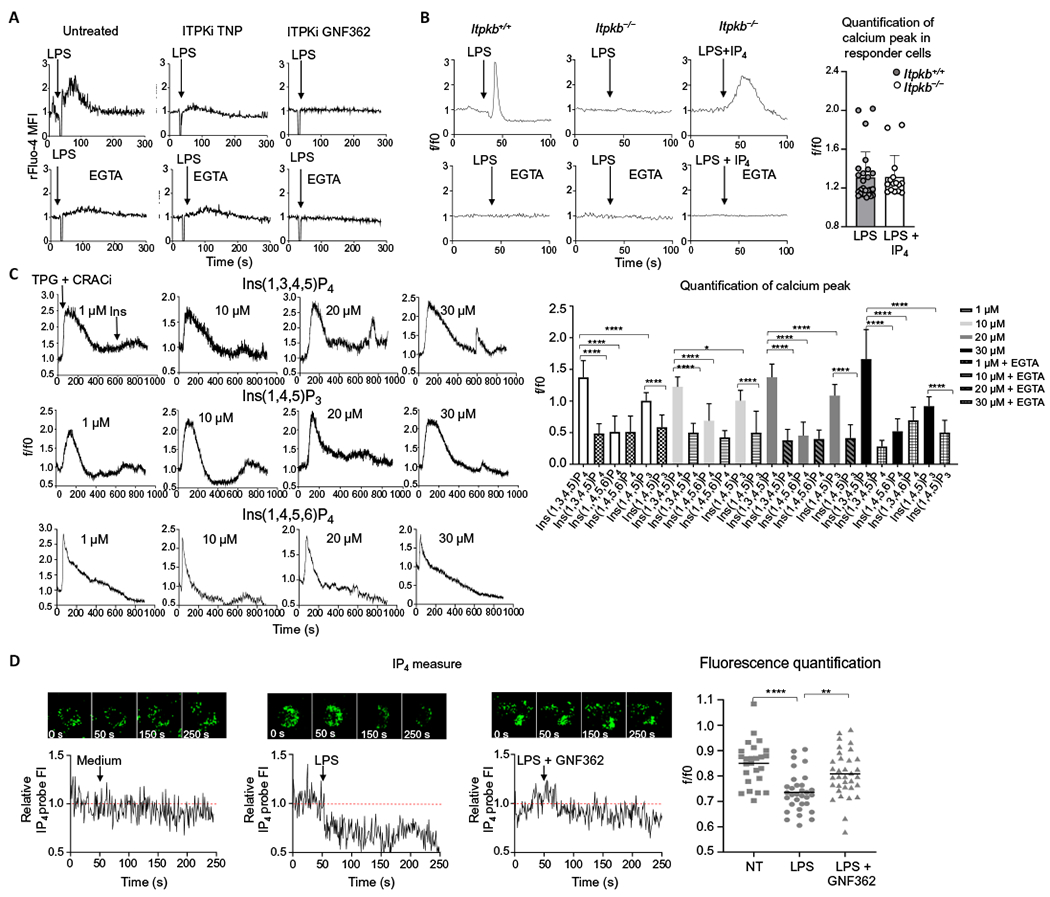
Fig. 5. IP4 is a second messenger required for Ca2+ mobilization in DCs after LPS stimulation.

(A) Ca2+ transients in mouse D1 cells that were untreated or pretreated with the ITPK inhibitors (ITPKi) TNP or GNF362 before being stimulated with LPS in the absence or presence or EGTA, as indicated. Arrows indicate LPS administration at 30 s. Ca2+ fluctuations were evaluated by FACS on the bulk population as changes in the Fluo-4 fluorescence in response to the stimuli and normalized over the first 30 s of analysis (rFluo-4 MFI). Traces are representative of three independent experiments. (B) Representative Ca2+ transients in BMDCs from WT (Itpkb+/+) and Itpkb−/− mice in the presence or absence of EGTA. Arrows indicate the addition of LPS or LPS plus IP4 at 40 s. Ca2+ fluctuations were measured by confocal microscopy as changes in Fluo-4 fluorescence in response to the stimuli and normalized over the first 40 s of analysis (rFluo-4 MFI). A minimum number of 100 cells in each group was analyzed. The quantification analysis shows the increase of fluorescence intensity in the peak interval in n = 25 responder cells. (C) Representative Ca2+ profiles of D1 cells pretreated with CRAC inhibitor (CRACi) YM-58483 and then treated with thapsigargin (TPG) to deplete the intracellular Ca2+ stores and, last, with cell-permeant Ins(1,3,4,5,)P4, Ins(1,4,5)P3, or Ins(1,4,5,6)P4 at the indicated doses (see also fig. S5 for Ca2+ plots in the presence of EGTA). Thapsigargin was added after 30 s and inositols after 600 s of data acquisition. Ca2+ fluctuations were evaluated as changes in Fluo-4 fluorescence in response to the stimuli and normalized over the first 30 s of analysis (rFluo-4 MFI). The quantification analysis shows the increase of fluorescence intensity in the peak interval with respect to the first 30 s for responder cells or the increase of fluorescence intensity after the addition of inositols (600 s) until the end of the experiment (900 s) for nonresponder cells. Statistical significance was determined using one-way analysis of variance, followed by Sidak’s multiple comparisons test, ****P < 0.0001 and *P < 0.05, n = 20 responder cells. Data are representative of three independent experiments. (D) Measure of IP4 increase revealed by confocal microscopy in D1 cells transfected with a fluorescent probe that is quenched by IP4 binding and pretreated (or not) with GNF362. Arrows indicate administration of plain medium or LPS at 50 s. Fluctuations in IP4 amounts were evaluated as changes in the IP4 probe fluorescence in response to the stimuli and normalized over the first 50 s of analysis (relative IP4 probe FI). Traces show a representative profile of a single cell with the corresponding images at the indicated time points. The quantification analysis shows the mean of the intensities of IP4 probe after LPS administration, normalized over the first 50 s of analysis (f/f0). Statistical significance was determined using one-way analysis of variance, followed by Tukey’s multiple comparisons test, ****P < 0.0001 and **P < 0.01, n = 25 cells. Data are representative of three independent experiments.
