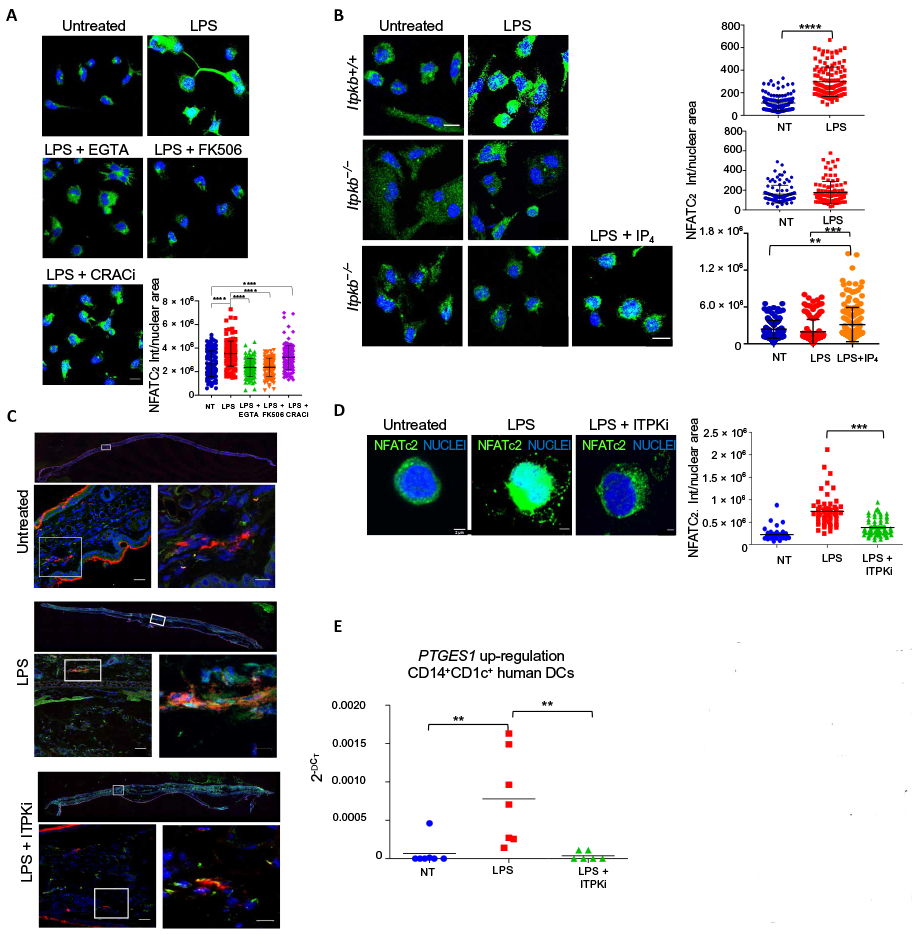
Fig. 6. ITPKs are essential for LPS-dependent activation of the NFAT signaling pathway in vitro and in vivo.

(A) Representative confocal immunofluorescence images showing NFATc2 in mouse BMDCs treated (or not) with LPS 1.5 hours in the presence or absence of EGTA, the calcineurin inhibitor FK506, or the CRAC inhibitor YM-58483 (CRACi). Nuclei were counterstained blue. Scale bar, 10 μm. Quantification of NFATc2 nuclear signal is shown. Statistical significance was determined using one-way analysis of variance, followed by Tukey’s multiple comparisons test, ****P < 0.0001, n = 105 cells from three independent experiments. (B) Representative confocal immunofluorescence images showing NFATc2 in BMDCs isolated from Itpkb+/+ or Itpkb−/− mice and treated (or not) with LPS for 1.5 hours in the presence or absence of cell-permeant IP4. Nuclei were counterstained blue. Scale bar, 10 μm. Quantification of NFATc2 nuclear signal is shown. Statistical significance was determined using one-way analysis of variance, followed by Tukey’s multiple comparisons test or using unpaired student’s t test. ****P < 0.0001 and **P < 0.01, n = 100 cells from three independent experiments. (C) Confocal immunofluorescence images showing NFATc2 (green) and MHCII (red) in ear sections of mice 1.5 hours after subcutaneous injection of PBS (untreated), LPS, or LPS plus the ITPK inhibitor TNP (ITPKi). Nuclei were counterstained blue. Images are representative of three independent experiments. Insets of each panel represent higher magnifications of the selected areas. Scale bars, 25 μm (lower magnification inset), 10 μm (higher magnification inset). ***P < 0.001. (D) Immunofluorescence showing NFATc2 in human CD1c+CD14+ cells, treated (or not) with LPS for 1.5 hours. Where indicated, cells were preincubated with the ITPK inhibitor TNP (ITPKi). Nuclei are counterstained blue. Scale bars, 2 μm. Quantification of the NFATc2 nuclear signal is shown. Statistical analysis was performed with one-way analysis of variance followed by Bonferroni’s multiple comparisons test, ***P < 0.001, n = 60 cells from three different donors. (E) Real-time PCR analysis of PTGES1 expression in human CD1c+CD14+ cells treated (or not) for 4 hours with LPS in the presence or absence of ITPK inhibitor TNP (ITPKi). n = 7 donors. Statistical significance was performed with Wilcoxon test. **P < 0.01.
