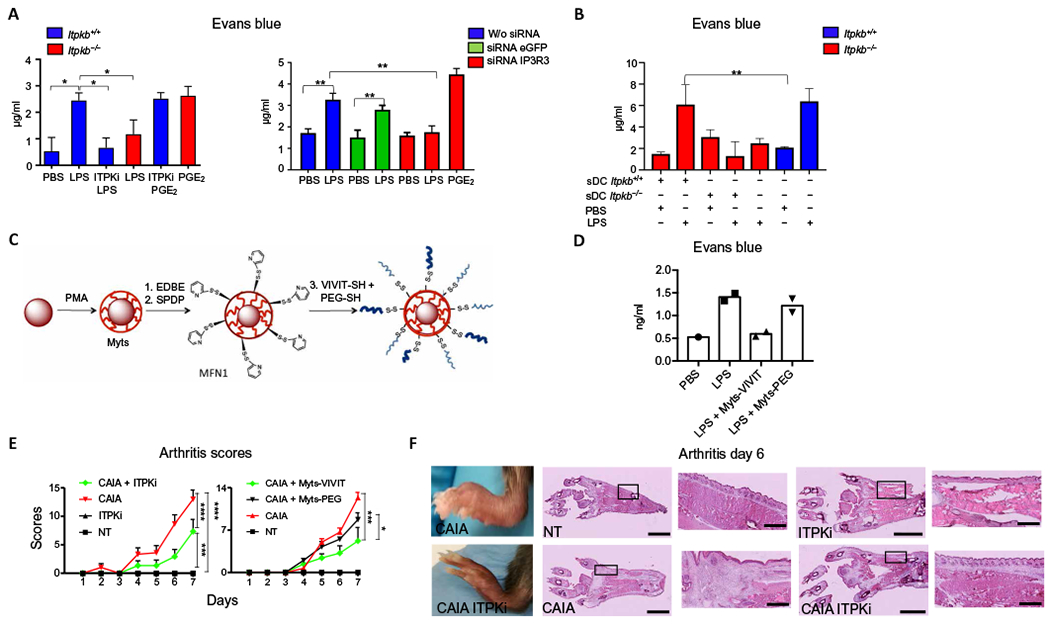
Fig. 7. ITPK inhibition in vivo reduces the inflammatory events promoted by NFAT.

(A) Quantification of Evans blue extravasation in the ears of mice. WT (Itpkb+/+) and Itpkb−/− mice were simultaneously injected intravenously with Evans blue and subcutaneously with PBS or the indicated combinations of LPS, PGE2, and the ITPK inhibitor TNP (ITPKi). Mice treated with siRNAs targeting IP3R3 or eGFP or with vehicle alone (w/o siRNA) 24 hours before the assay were also injected with PBS or LPS. Data represent Evans blue quantification from excised ears 30 min after challenge. Values indicate mean ± SD from three mice. Statistical significance was determined with Mann-Whitney test, ***P< 0.001, **P< 0.01, and *P< 0.05. (B) Vascular leakage assay as in (A). Itbk−+/+ or Itbkb−/− DCs were subcutaneously injected (sDC) into the ears of Itbk−+/+ or Itbkb−/− mice before PBS or LPS treatment. The values indicate mean ± SD from three mice for each experimental condition. Statistical significance was determined with one-way analysis of variance, followed by Sidak’s multiple comparisons test, **P < 0.01. (C) Schematic representation of Myts nanoparticles functionalized with thiol-reactive groups and then conjugated with a mixture of VIVIT-SH peptide and PEG-SH, to yield Myts-VIVIT. SPDP, N-succinimidyl-3-[2-pyridylthio]-propionate. MFN1, Myts functionalized with thiol-reactive group. (D) Vascular leakage assay as in (A). Mice were treated with Myts-VIVIT or control Myts-PEG nanoparticles intravenously before LPS treatment. Each symbol represents an individual mouse. (E) CAIA clinical scores evaluated at the indicated time points. Mice were treated with ITPKi every other day starting from day −1 or with Myts-VIVIT or Myts-PEG nanoparticles every other day starting from day −1. Values represent mean ± SD. Statistical significance was performed with one-way analysis of variance, followed by Tukey’s multiple comparisons test. The one-way analysis of variance revealed a variation over time (P < 0.0001), differences between groups (P < 0.0001), and interactions between groups (P < 0.0001). ****P < 0.0001, ***P < 0.001, and *P < 0.05. n = 6 mice for each treatment regimen. (F) Images of intact and hematoxylin and eosin-stained sections of hindlimbs of mice 6 days after CAIA induction that were untreated (NT) or treated with ITPKi. Images are representative of six animals for each treatment group. Scale bars, 2.5 mm (whole sections), 0.5 mm (insets).
