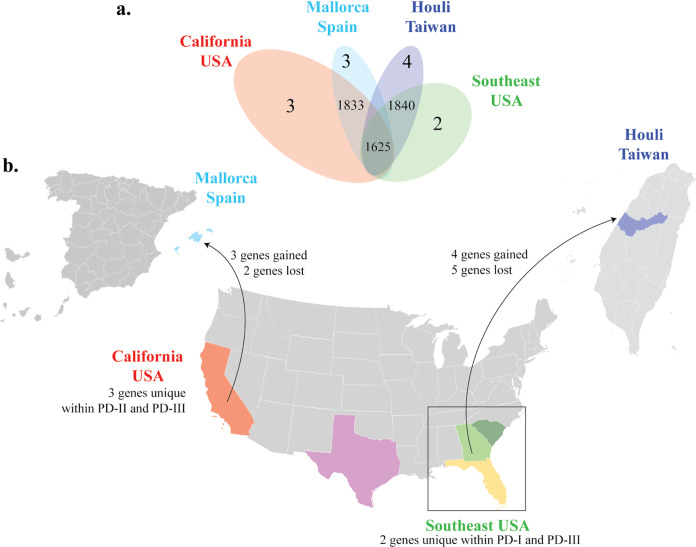
FIG 3.
Venn diagram and maps showing population-linked gene gain/loss events among PD-causing isolates. Color represents isolates from the same geographical location: California (red), Texas (pink), Georgia (green), North Carolina (dark green), Florida (yellow), Spain (light blue), and Taiwan (dark blue). (a) Venn diagram shows both the number of genes shared between geographic PD-causing populations and genes unique to each population. The size of the oval represents sample size. (b) Estimated number of genes gained and lost between geographical locations and following introduction events. Arrows point from the source population to its descendant following introduction events. California isolates belong to the phylogenetically distinct clades PD-II and PD-III. Included Southeast isolates belong to the phylogenetically distinct PD-I and PD-III clades. All maps were publicly available from Wikimedia commons (Blank US map 1864.svg, Provinces of Spain - blank map.svg, and Blank Taiwan map.svg).

