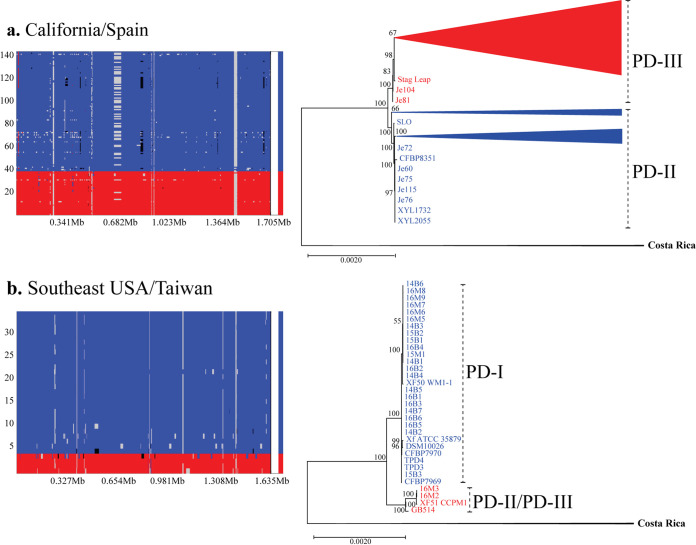
FIG 4.
Frequency and location of recombination events in fastGEAR identified lineages. Analysis shows results for the California/Spain population (a) and the Southeast United States/Taiwan population (b). FastGEAR’s recombination plots show two distinct lineages on each population (red, PD-III in California/Spain and PD-II/PD-III in Southeast United States/Taiwan; blue, PD-II in California/Spain and PD-I in Southeast United States/Taiwan). The recombination events are shown across the length of the core genome alignment. Larger areas represent recipient sequences, while shorter segments of different color within those areas represent donor sequences from another lineage. Recombinant segments from unidentified lineages are shown in black. Maximum likelihood (ML) trees showing the phylogenetic relationship of isolates within each intrapopulation cluster identified by fastGEAR are also included. Trees were built using the core genome alignment without removing recombinant segments for the California/Spain and Southeast United States/Taiwan populations. Bootstrap values mark branch support.

