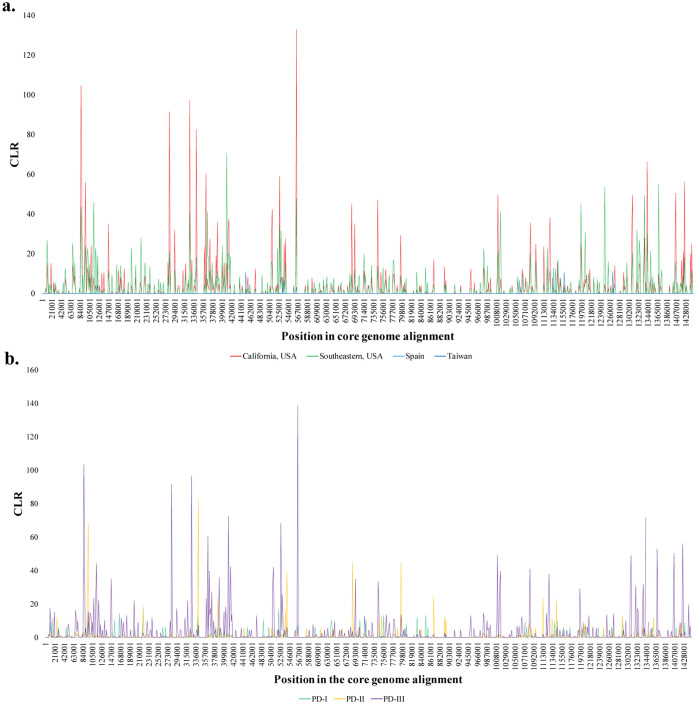
FIG 5.
Line plot showing variations in Nielsen’s composite likelihood ratio (CLR) across the length of the core genome alignment (1,500-bp window size). The CLR identifies regions with aberrant allele frequency and determines if their distribution matches those expected from a selective sweep. Peaks represent higher CLR values at that position, which is indicative of a putative selective sweep. Color represents isolates from the same geographical location or phylogenetic cluster. (a) Lines indicate distinct geographic population: California (red), Southeast United States (green), Spain (light blue), and Taiwan (dark blue). (b) Lines indicated distinct phylogenetic clusters: PD-I (teal), PD-II (yellow), and PD-III (purple).

