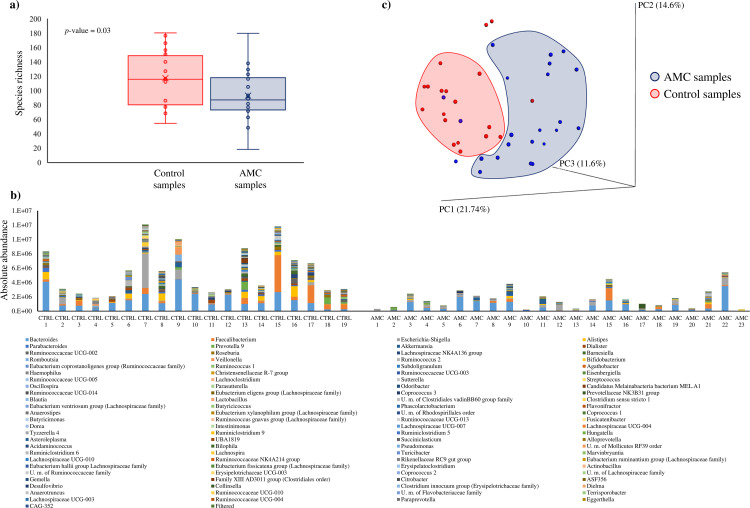
FIG 1.
Evaluation of the microbiota composition of amoxicillin-clavulanic acid (AMC) and control (CTRL) samples. (a) Whisker plot based on observed OTUs identified from AMC and CTRL samples. The x axis represents the different groups, while the y axis indicates the number of observed operational taxonomic units (OTUs). The boxes represent 50% of the data set, distributed between the first and the third quartiles. The median divides the boxes into the interquartile range, while “X” represents the mean. (b) Microbiota composition of AMC and CTRL samples based on 16S rRNA profiling normalized with a quantitative microbiome profiling approach employing flow cytometric enumeration of microbial cells for each sample. The x axis represents the different analyzed samples, while the y axis indicates normalized OTUs for each sample. (c) Beta diversity in AMC and CTRL samples. The predicted PCoA results encompassing all 43 analyzed samples are reported and the different clusters are represented by different colors.

