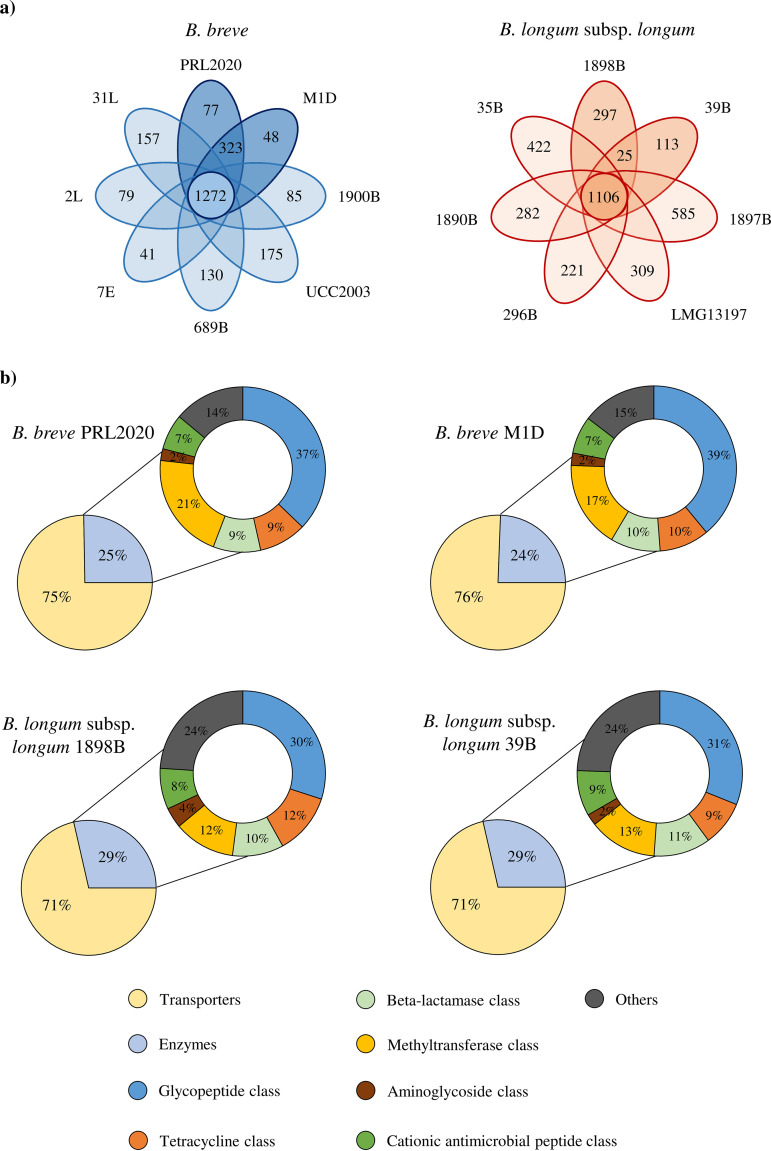
FIG 2.
Comparative genomic and resistome analyses of AMC-resistant Bifidobacterium strains. (a) Venn diagrams. The numbers in the central circles represent the numbers of genes in the core genomes of the B. breve and B. longum subsp. longum strains analyzed. The numbers in the overlapping sections represent the numbers of shared genes between AMC-resistant strains, while the numbers in the ovals depict the number of TUGs for each strain. (b) Predicted resistomes of the AMC-resistant Bifidobacterium strains.

