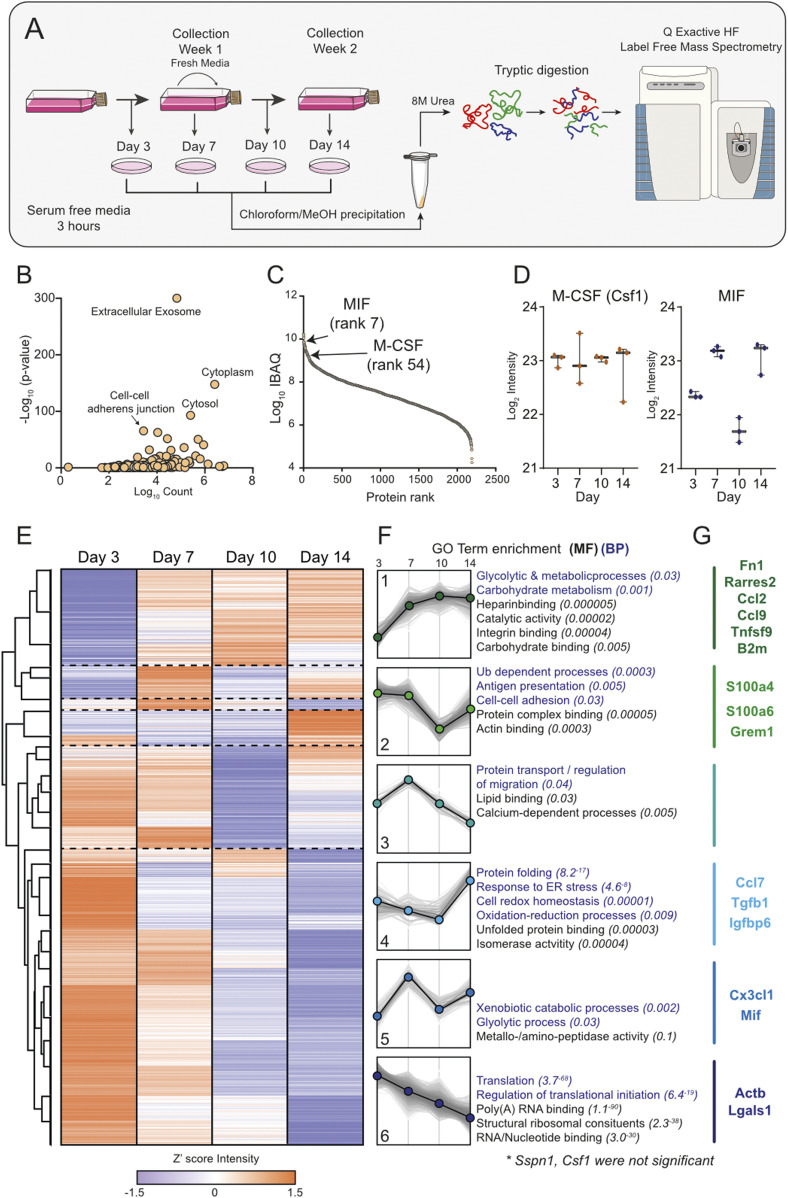
Figure 1. L929 cell–conditioned media proteome.
(A) Workflow. Graphical representation of the collection of L929 supernatant over 14 d and the corresponding secretome collections for proteomic analysis. (B) Gene Ontology analysis of proteins identified in LCCM shows enrichment of exosomes and cytoplasmic proteins. (C) Log10 intensity-based absolute quantification values ranking of proteins from the L929 secretome showing positions of MIF and M-CSF. (D) Z′-scored heat map of ANOVA significant proteins across the sampling days. (E) Six distinct cluster profiles that show different secretion patterns over time with purple dots indicating down and orange dots up regulation. (F) Associated molecular function and biological process gene ontology terms for the six cluster profiles. (G) Intensity levels of M-CSF (CSF1) and MIF in LCCM over the 2-wk growth period of L929 cells. Error bars in (E) represent SD.

