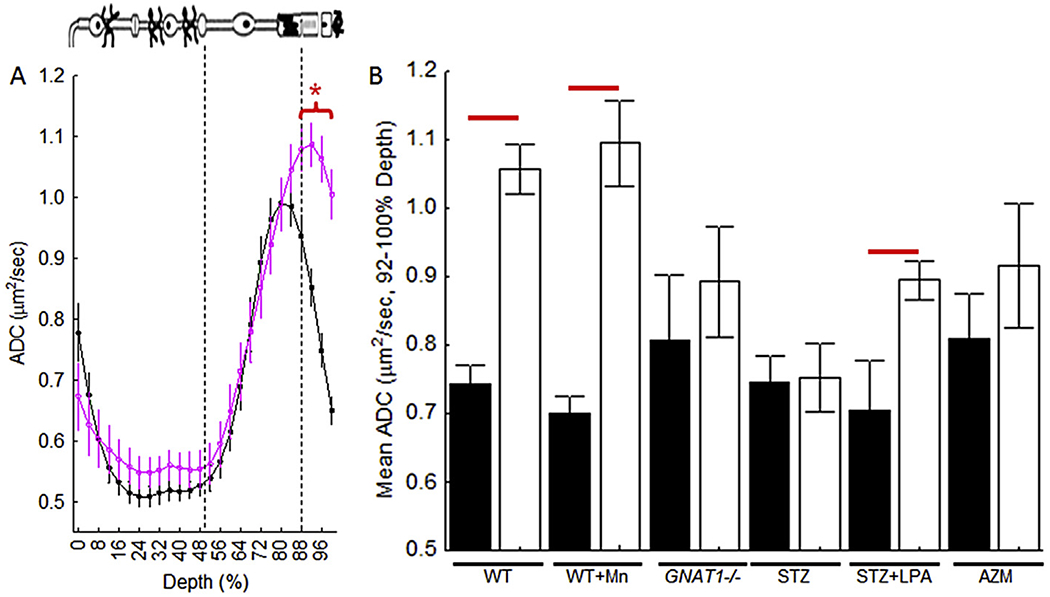
Fig. 11.

Light detection using ADC MRI. A) Summary of central retinal ADC with retinal depth during dark (closed symbols, n = 23) and light (open symbols, n = 23) in untreated mice (WT). Approximate location of retinal layers is indicated (dotted blue lines and insert cartoon). Profiles are spatially normalized to retinal thickness (0% = vitreous/retina border, 100% = vitreous/choroid border). Red bracket/horizontal line, P < 0.05. B) Summary of paired data (filled = dark, open = light) of WT (n = 23), MnCl2-treated mice (WT + Mn, n = 6), GNAT1−/− mice (n = 6), untreated + vehicle treated diabetic mice (STZ, n = 9), diabetic mice treated acutely with the anti-oxidant a-lipoic acid (STZ + LPA, n = 8), on-diabetic acetazolamide-treated mice (AZM, n = 8) (Berkowitz et al., 2015a).
