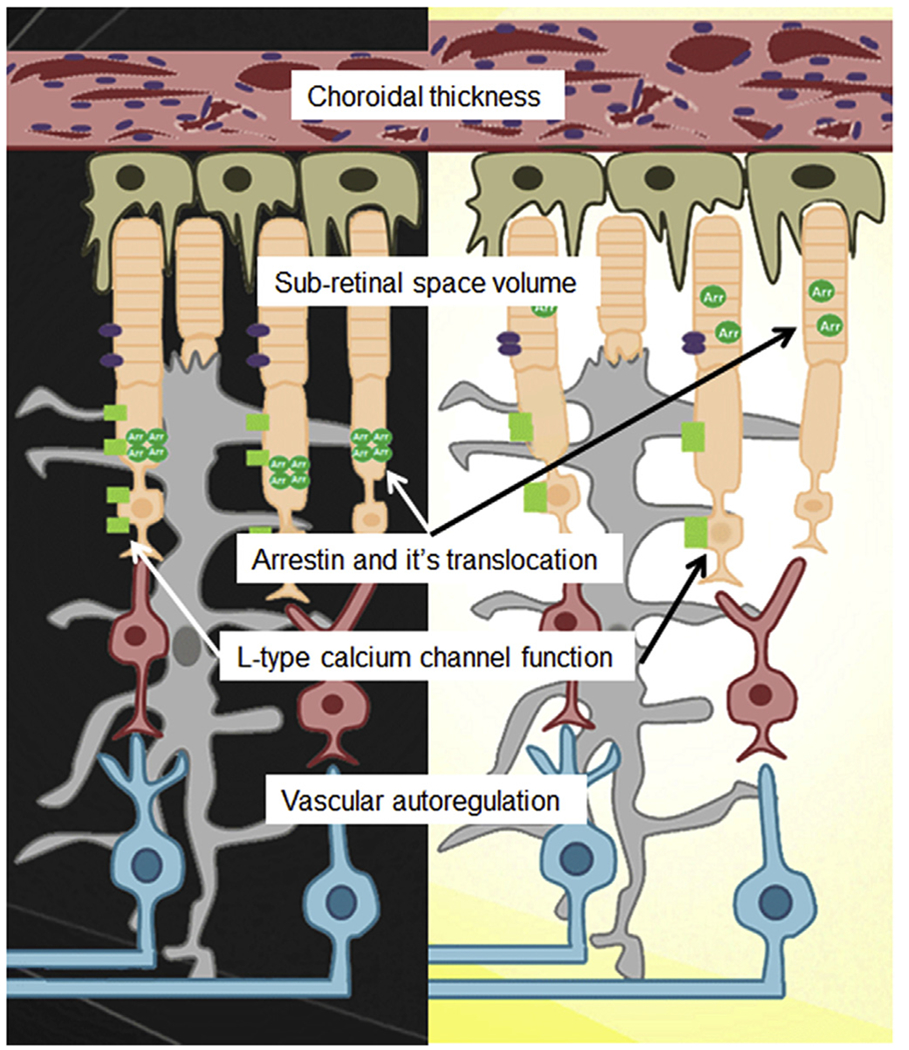
Fig. 3.

Simplified illustration of the rod cell functionome (white boxes in center) in dark (left) and light (right) as assessed by multi-functional MRI metrics. The array of essential information measured by MRI (shown in the white boxes) is unavailable from other imaging methods. Inner retinal circulatory plexi are not shown. Drawing courtesy of Jawan Gorgris.
