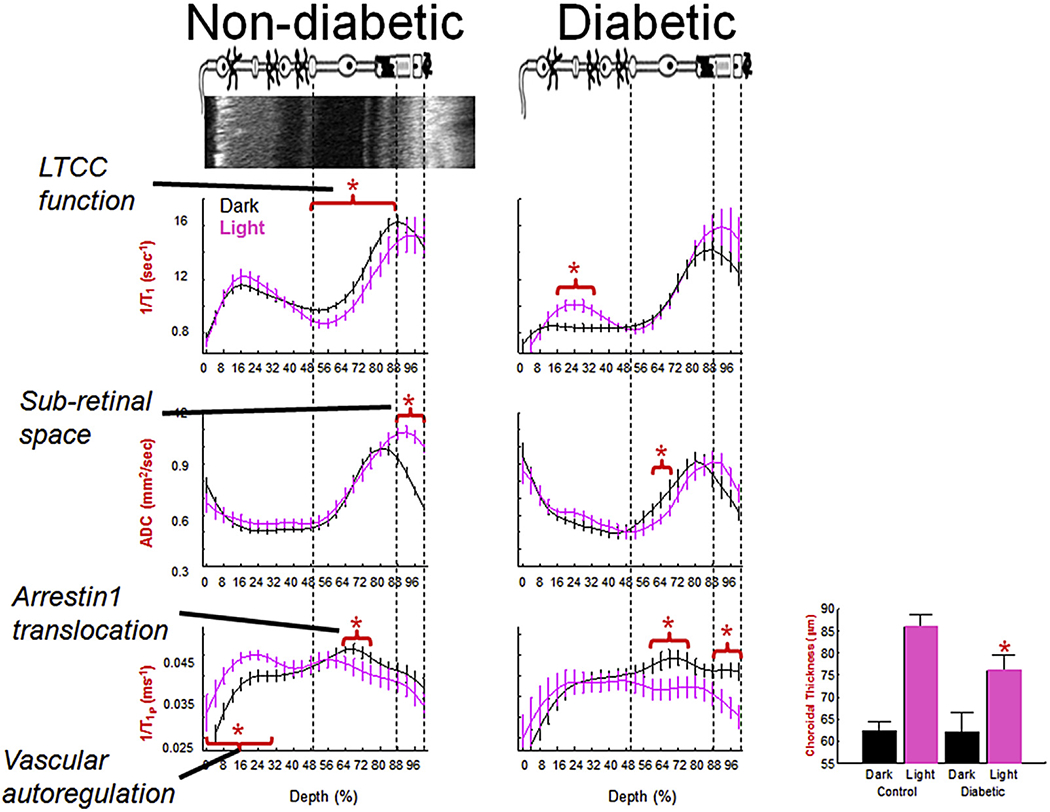
Fig. 4.

Summary of multi-functional MRI (graphs) spatially registered to OCT (top image, left). Rod functions in dark (black line) vs. light (pink line) in non-diabetic (left column) and diabetic (right column) mice. In summary, diabetes impairs light-evoked functions (except arrestin1 and its translocation) and these abnormalities were correctable with antioxidant treatments (Table 1). N’s for the dark and light data, respectively, are as follows: LTCC graphs (wt: 19 and 11, diabetic: 6 and 7); Sub-retina space graphs: (wt: 23 and 23, diabetic: 9 and 9); 1/T1ρ graphs (wt: 7 and 7, diabetic: 5 and 5). Light-evoked choroidal expansion is maintained in diabetics but to a significantly reduced degree (bargraph, paired dark/light data, n = 18 (wt) and 9 (diabetic)); an antioxidant did not correct this abnormality. *, P < 0.05. Data for each graph is obtained from central (+/− 0.4 − 1 mm from the optic nerve head) retina and shown as a function of distance from retina/non-retina borders, where 0% is the vitreous/retina border and 100% is the retina/choroid border. Above graphs: simplified schematic of retina and support circulations (Paques et al., 2003;Wangsa-Wirawan and Linsenmeier, 2003; Zhi et al., 2014). Red horizontal bracket and star above profiles indicates specific retinal regions with significant (P < 0.05) light-evoked differences. Based on OCT data (Fig. 4), vertical dashed lines approximate layer locations in retina.
