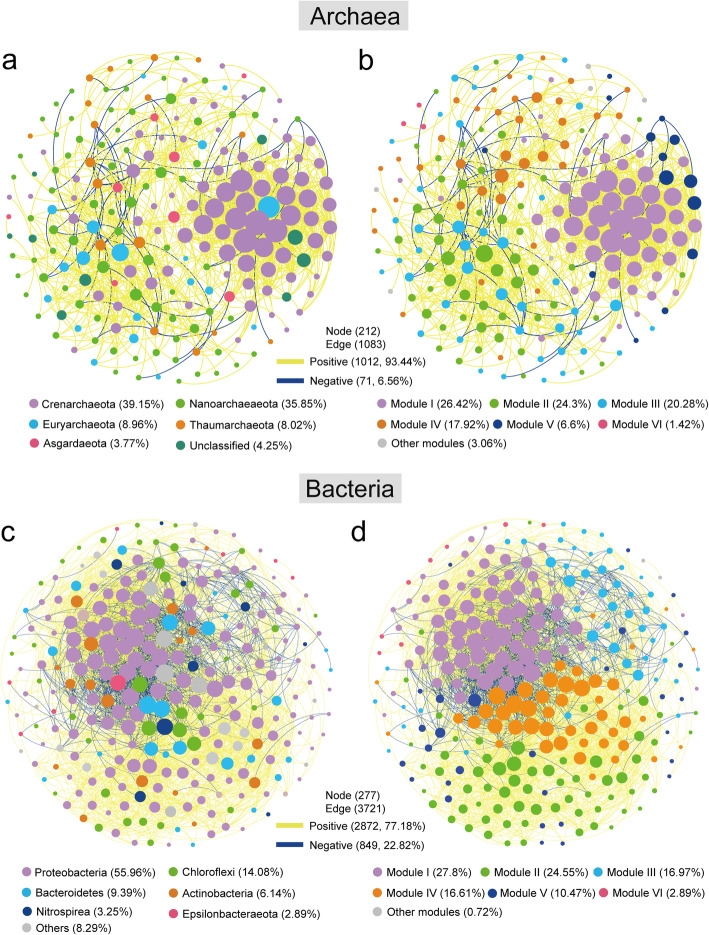
Fig. 3.
Overall co-occurrence networks of the archaeal and bacterial communities based on pairwise Spearman’s correlations between OTUs. The nodes were colored according to different types of phylums (a, c) and modularity classes (b, d), respectively. A connection stands for a strong (Spearman r > 0.6 or r < −0.6) and significant (P-value < 0.01) correlation. For each panel, the size of each node is proportional to the number of connections (i.e. degree). The yellow and blue edges indicate negative and positive interactions between two individual nodes, respectively

