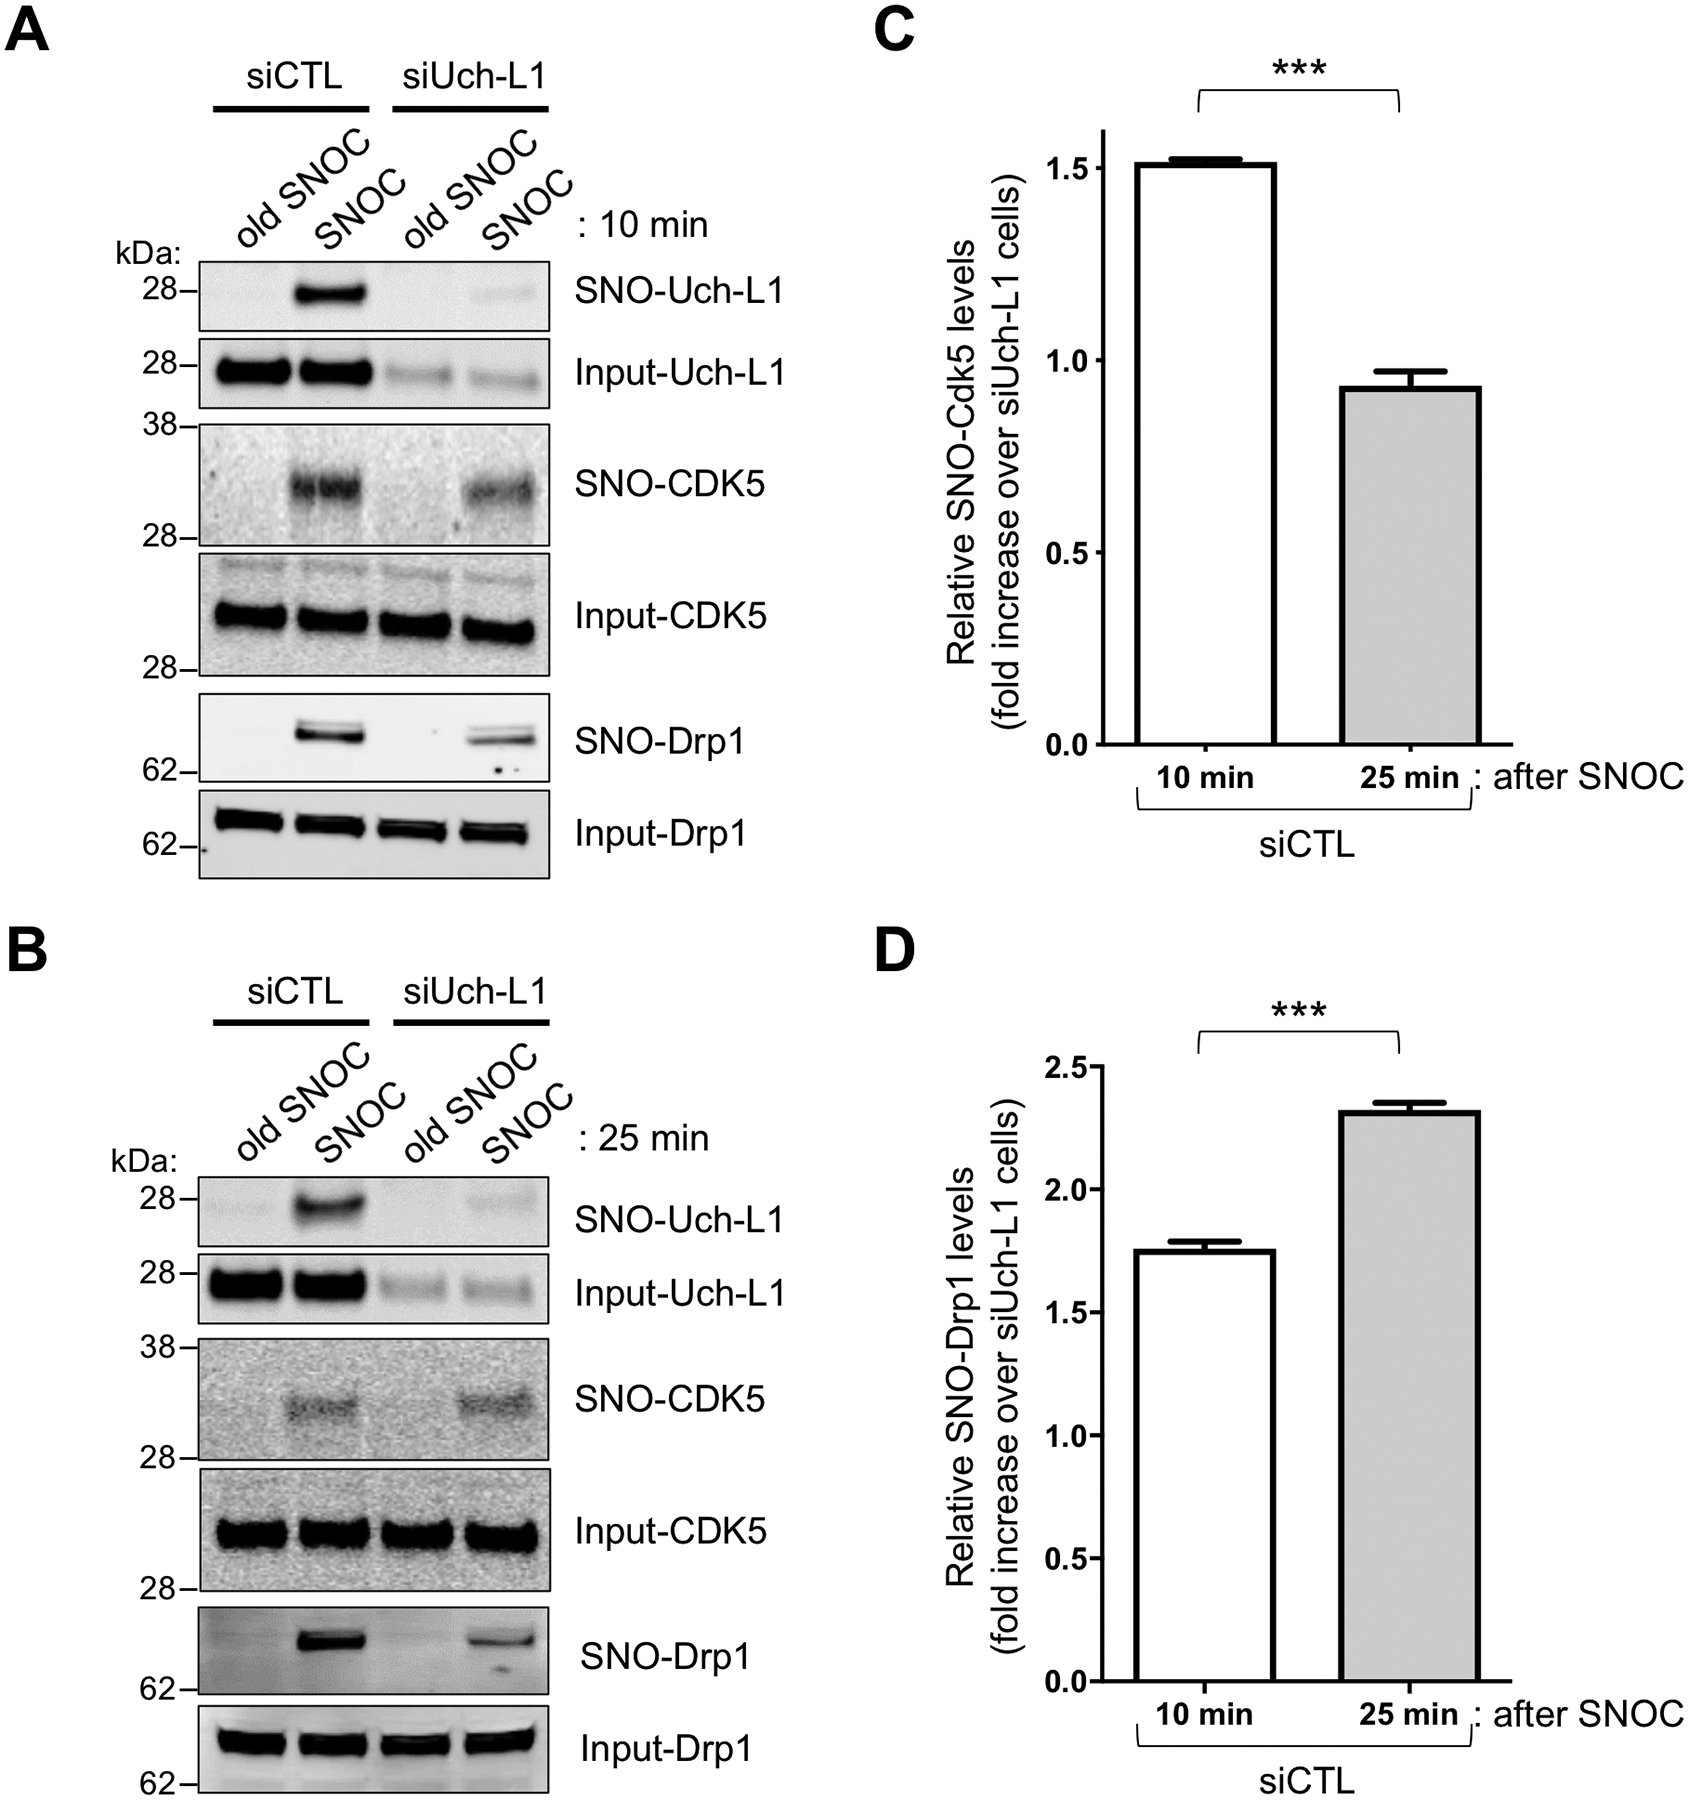
Fig. 4. Transnitrosylation from SNO-Uch-L1 to Cdk5 on biotin-switch assays.

(A) SNO-Uch-L1 formed 10-min after exposure of HEK-293 cells to 100 μM SNOC, but not after exposure to control represented by ‘old’ SNOC from which the NO group had been dissipated, although this solution might still contain nitrite and disulfides. Formation of SNO-Cdk5 was also observed, and this was partially abrogated by siRNA knockdown of Uch-L1 (siUch-L1) compared to control siRNA (siCTL) cells. (B) Knockdown of Uch-L1 largely prevented formation of SNO-Drp1, which first appeared 25 min after exposure to SNOC. (C) Quantification of SNO-Cdk5 on biotin-switch blots. Relative SNO-Cdk5 levels (SNO-protein/Input protein) in siCTL cells were increased 10 min after exposure to SNOC vs. 25 min when compared to siUch-L1 cells exposed to SNOC. Values are mean + SEM (n = 3 per group). ***P < 0.001 by two-tailed Student’s t test. (D) Similar type of quantification of SNO-Drp1 on biotin-switch blots. In this case, relative SNO-Drp1 levels were increased 25 min after exposure to SNOC vs. 10 min. Values are mean + SEM (n = 3 per group). ***P < 0.001 by two-tailed Student’s t test.
