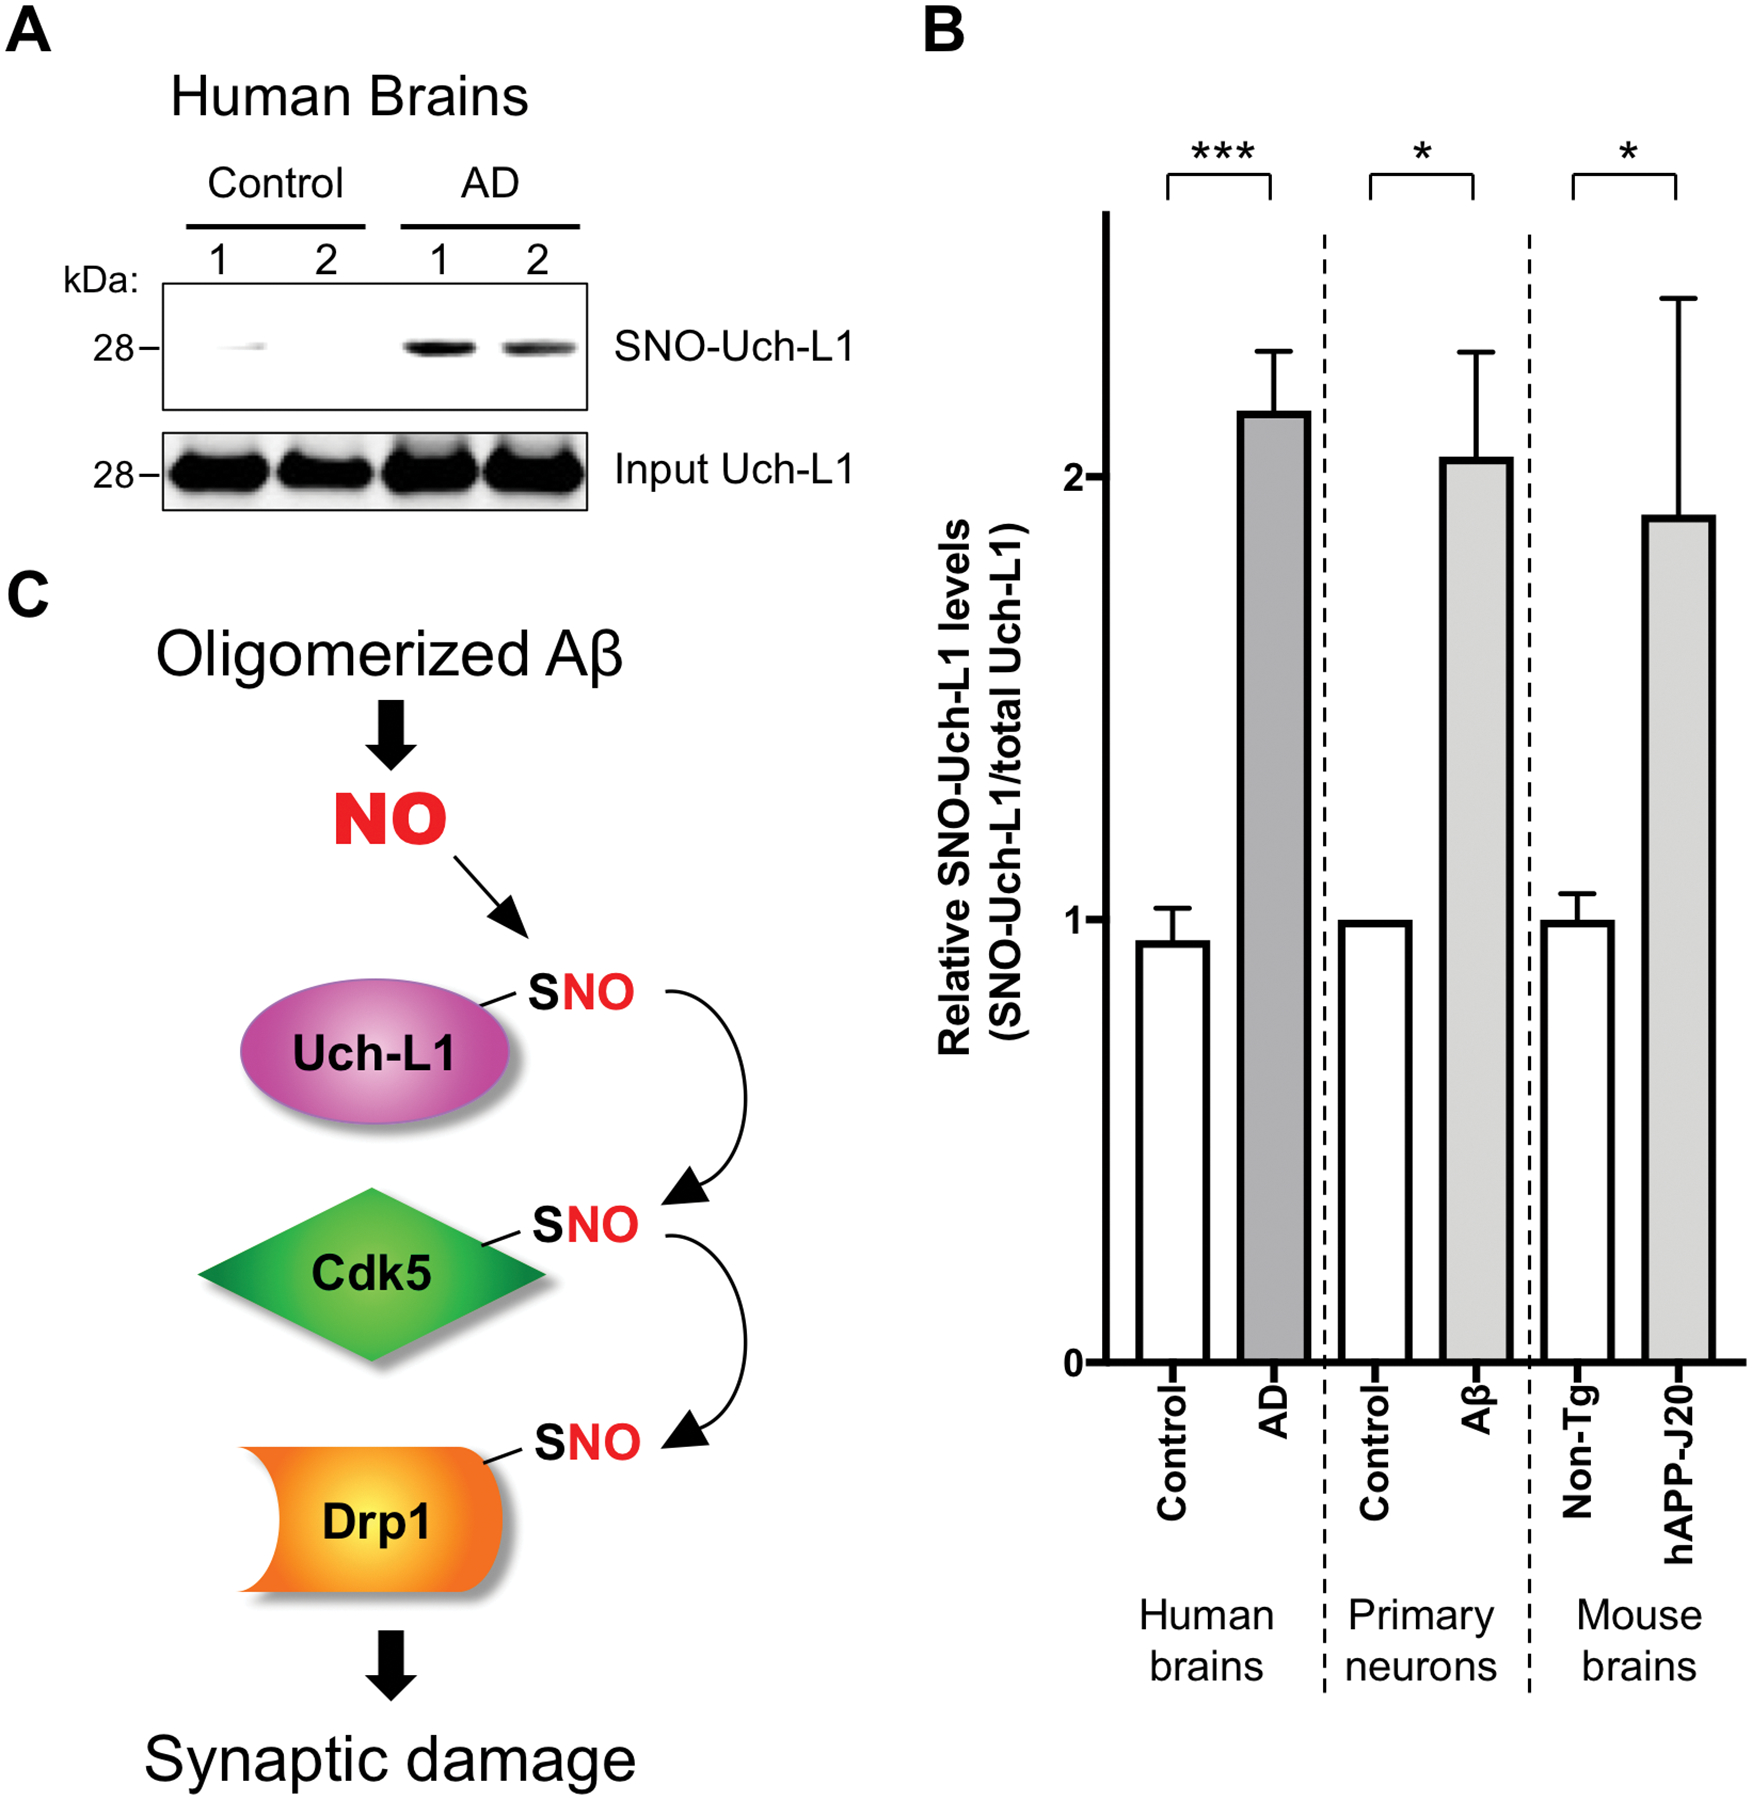
Fig. 7. S-Nitrosylation of Uch-L1 in human AD brains and schema of transnitrosylation in the pathophysiology of synapse loss in AD.

(A) Human brain tissues from control or AD patients were subjected to the biotin-switch assay to detect SNO-Uch-L1. (B) Quantification of the ratio of SNO-Uch-L1 to total Uch-L1 in human brains and in cell-based assays. Biotin-switch assays and immunoblot analyses were quantified by densitometry, and the relative ratio of SNO-Uch-L1 to total Uch-L1 was calculated for the following conditions: In vitro in cerebrocortical neurons after Aβ exposure (as shown in Figure 3A), in vivo in the hAPP-J20 mouse model of AD (as shown in Figure 1C), and in human AD brains vs. control human brains. Values are mean + SEM (n = 6 for control human brains, n = 7 samples from 5 AD human brains, n = 3 for each group in primary neuron experiments, n = 6 for each group in mouse brain experiments). ***P < 0.001, *P < 0.05 by Student’s t test. (C) Biochemical schema of transnitrosylation pathway leading to synaptic damage and consequent memory loss in AD. Note that these transnitrosylation reactions may be direct or indirect, with additional, as yet unknown, members of the transnitrosylation network still to be discovered.
