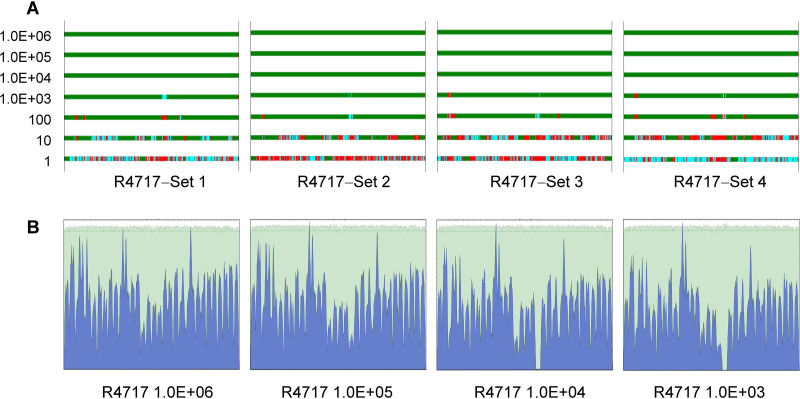
FIG 2.
Genome coverage and sequence mapping alignment depth for MiSeq reads data. SARS-CoV-2 isolate R4717 RNA serial dilutions were subjected to Fluidigm RT-PCR amplification and MiSeq sequencing. Data were mapped using genome NC_045512.2 as the reference. (A) Genome coverage for 10× serial dilutions of R4717 RNA from 1.0E + 06 (top) to 1 (bottom) copies. Mapping depth was indicated in colors as follows: green, normal depth (depth ≥ 10); cyan, dip (depth 1 to 10); red, gap. Results for four replicates are shown. (B) Sequence mapping graphs for 106, 105, 104 and 103 copies of RNA from one set of serial dilutions.

