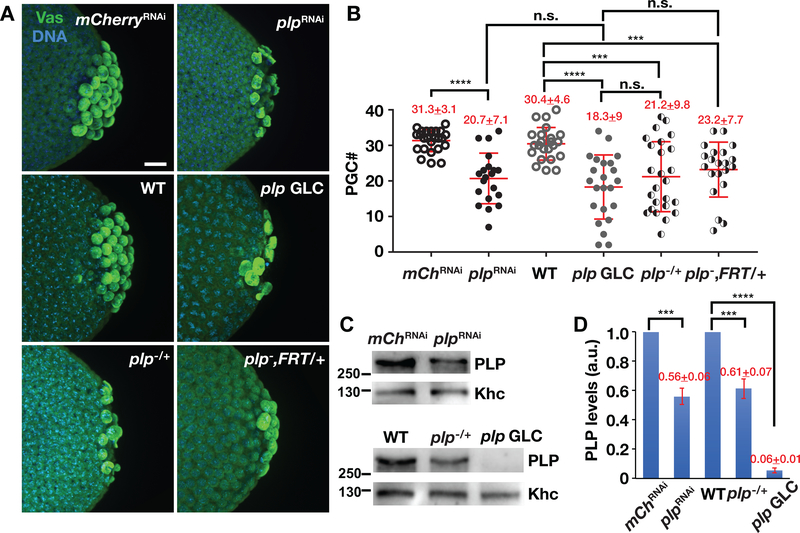
FIGURE 1.
PLP promotes PGC formation. (a) Images show maximum-intensity projections of NC 13–14 embryos of the indicated genotypes stained with anti-Vas (green) to label PGCs. In this and all images, posterior is to the right. Bar, 10 μm. (b) Quantification of PGCs from NC 13–14 embryos. Each data point represents one embryo. Mean ± SD PGCs are displayed (red). mChRNAi (mCherryRNAi, N = 24 embryos); plpRNAi (N = 20 embryos); WT (N = 23 embryos); plp GLC (N = 23 embryos); plp−/+ (plp2172/+; N = 25 embryos); plp−, FRT/+ (plp2172,FRT2A/+, N = 21 embryos). ****p < .0001, ***p < .001, n.s., not significant by Student’s t test. The experiment was performed twice with similar results. (c) Western blot analysis of PLP expression from 0 −2 hr embryo extracts of the indicated genotypes. Anti-Khc antibodies were used for normalization. (d) Densitometry quantification of PLP levels from western blot analysis. PLP expression values are relative to the loading control, anti-Khc, and normalized to the mCherryRNAi or WT. Mean ± SD from three replicates are displayed (red). a.u., arbitrary units; ****p < .001, ***p < .001 by Student’s t test. PGC, primordial germ cells; PLP, Pericentrin-like protein; WT, wild-type

