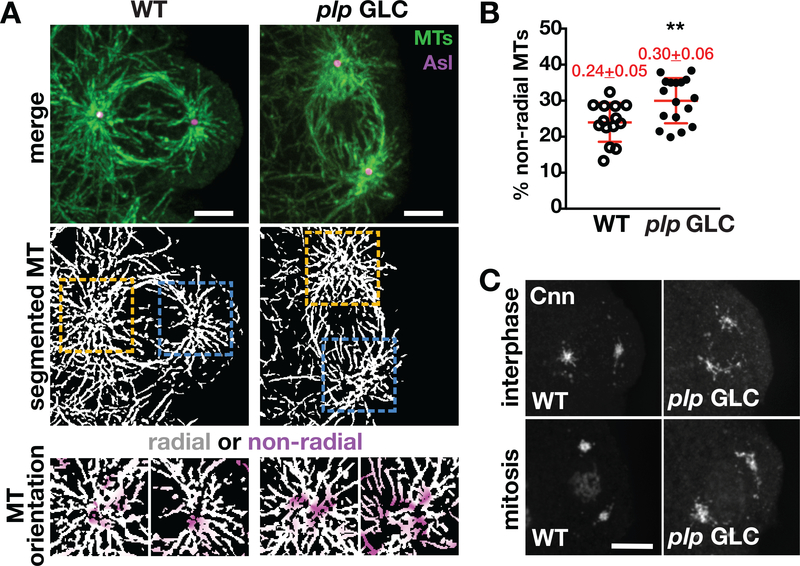
FIGURE 6.
PLP organizes the astral microtubule array within PBs. (a) Microtubule organization in PBs from the indicated genotypes. Top row: single focal plane images stained for α-Tub (MT, green) to visualize microtubule organization in late interphase/early prophase NC 11 embryos costained with anti-Asl (magenta) antibodies. Middle row: segmented images of microtubules. Boxed regions mark region used for radiality analysis, enlarged below. Bottom row: A squared ROI (6 μm dashed square centered on the centriole) was selected and used to measure microtubule radiality. Segmented images were split into a radial and nonradial component based on microtubule orientation relative to the centriole as described in Materials and Methods. Images show merged radial (white) and non-radial (magenta) heat maps. Bar, 5 μm. (b) Quantification of the percentage of nonradial microtubules, as calculated in (a). Each data point represents the ratio of nonradial microtubules at a single centrosome from WT (N = 14 events from five embryos) and plp GLC (N = 17 events from six embryos). Mean ± SD are displayed (red). **p < .01 by a two-tailed Student’s t test. (c) Images show maximum-intensity projected PBs in NC 11 embryos of the indicated genotypes stained with anti-Cnn (gray scale). Bar: 5 μm. GLC, germline clone embryo; MT, microtubule; NC, nuclear cycle; PLP, Pericentrin-like protein; WT, wild-type

