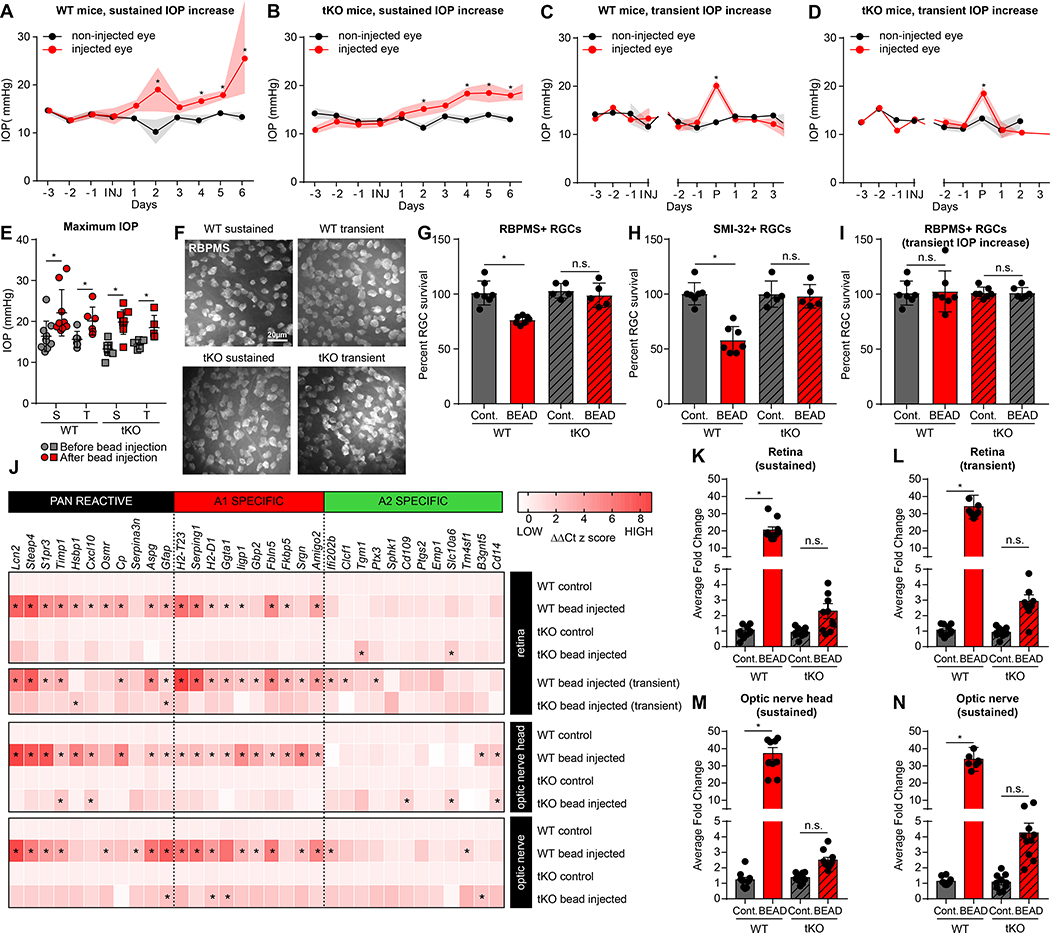
FIGURE 2. Bead injection glaucoma model increases intraocular pressure and causes astrocyte-dependent RGC loss.
A-D. Bead injection glaucoma produced increases in intraocular pressure (IOP) in wildtype (WT, A) and triple knock-out mice (tKO, Il1a−/−Tnf−/−C1qa−/−, B). Data in C/D are normalized around the day of peak (P) IOP increase. Refer to Supp. Figure S1 for individual animal plots. E. IOP maximum increase was approximately 20–30% in both wildtype (WT) and tKO mice. Similar maximal levels were reported in mice that had a sustained (S) increase in IOP (A/B), or transient (T) increase (C/D). F. Representative RBPMS+ staining of whole mount retinas from WT and tKO animals following sustained and transient IOP increase. Quantified in (G/I). G. IOP increase paired with death of RBPMS+ retinal ganglion cells in WT but not tKO mice following bead occlusion (compared to contralateral eye). There was a particularly large drop in SMI-32+ retinal ganglion cells (H). I. Mice with transient increase in IOP (C/D) had no loss of RGCs. J. Heat map of z-scores from microfluidic qPCR analysis highlights enrichment of reactive astrocyte transcripts in retina, optic nerve head, and optic nerve of bead-injected but not PBS-injected eyes of WT mice (largely absent in bead-injected eyes from tKO mice). K-N. Analysis of average fold induction for all reactive astrocyte transcripts (taken from J) highlights retinas from mice with transient increase in IOP that returned to baseline (see C) showed upregulated reactive astrocyte transcripts (same level as sustained IOP increase in the retina (K/L), optic nerve head (M), or optic nerve (N), see also Figure S2, S3). See also Supplemental Figures S1-S3. Abbreviations: tKO, triple knock out mice (Il1a−/−Tnf−/−C1qa−/−, neuroinflammatory reactive astrocyte deficient); S, sustained (IOP increase); T, transient (IOP increase); WT, wildtype. * P < 0.05, one-way ANOVA followed by Tukey’s multiple comparisons test. Individual data points representative of individual animals are plotted, while bars represent mean ± s.e.m. Scale bar is 20 μm for all micrographs in F.

