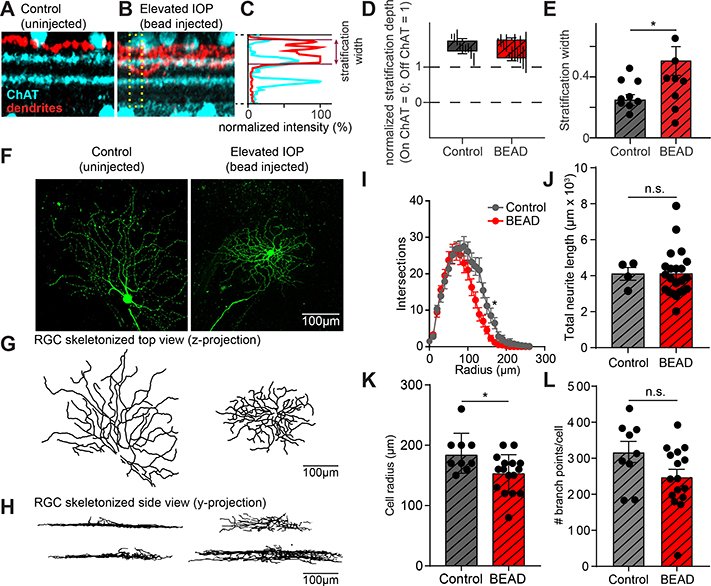
FIGURE 4. Dendrites of OFF-S RGCs in Il1a−/−Tnf−/−C1qa−/− KO mice stratify more broadly in the IPL following elevated IOP.
A. Example z-projection of a stack of confocal images taken from an OFF-S RGC from Il1a−/−Tnf−/−C1qa−/− mice under control conditions showing the level of RGC dendrites (red) and ChAT bands (cyan). B. Same as in (A) but from OFF-S RGCs from Il1a−/−Tnf−/−C1qa−/− mice under elevated IOP conditions. Dendrites stratify in approximately the correct location, but more broadly. C. The position and width of the dendrites in the IPL can be quantified. The normalized fluorescence intensity of the dendritic signal relative to that of the ChAT bands across a portion of the IPL (denoted by yellow box in (B)) is shown for a single RGC. By plotting the position of the dendrites relative to the normalized position of the ChAT bands, the position and width of the dendritic stratification can be quantified. D. Quantification of average stratification position within the IPL of OFF-S RGCs from Il1a−/−Tnf−/−C1qa−/− mice under control and bead-injected retinas. E. The dendrites of RGCs from bead-injected Il1a−/−Tnf−/−C1qa−/− mice stratified across a broader region of the IPL than RGCs from control retinas. F. Representative dye-filled RGC used for electrophysiological recordings. G-H. Ray-trace images of dye-fills pictured in (F) shown from the perspective of a flat retina (z-projection) to visualize the radial branching of RGCs (G) and from a side view(y-projection) to visualize dendritic position across layers of the retina (H). I. Sholl analysis of RGC process branching in control or bead-injected eyes. J-L. Quantification of number of dendritic branch points per cell (J), cell radius (K), and total neurite length (J) for RGCs in spared vs control retinas. All quantification performed on mice with sustained increases in IOP. * P < 0.05, unpaired t-test. Individual data points are plotted and represent individual cells from 4 animals (control) and 9 animals (bead-injected), while bars represent mean ± s.e.m. Scale bar is 100 μm for all micrographs in F.

