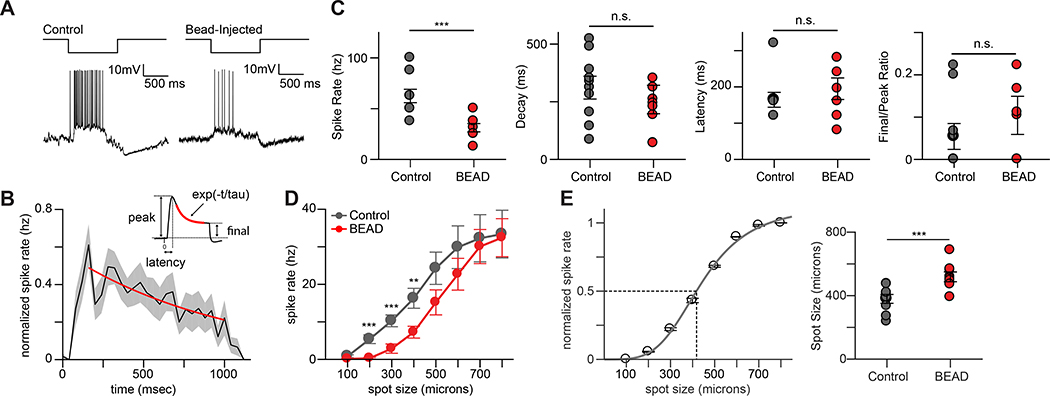
FIGURE 5. OFF-S RGCs in Il1a−/−Tnf−/−C1qa−/− KO mice show subtle changes in light response properties following elevated IOP.
A. Response of an OFF-S RGC from Il1a−/−Tnf−/−C1qa−/− mice to a one second long negative contrast pulse under control conditions (top) and after elevated IOP following bead injection (bottom). B. Mean normalized spike rate histogram from a population of OFF-S RGCs from Il1a−/−Tnf−/−C1qa−/− mice. Inset shows components of the spiking response used to analyze response properties in (C). C. Analysis of various light response properties of OFF-S RGCs. The peak spike rate (left) was significantly reduced in OFF-S RGCs from Il1a−/−Tnf−/−C1qa−/− mice that experienced elevated IOP. Other measurements of light response properties of OFF-S RGCs (decay, latency, and final/peak ratio) remained unchanged following bead-occlusion. D. Mean normalized responses of OFF-S RGCs to spots of increasing diameter in Il1a−/−Tnf−/−C1qa−/− KO mice under elevated IOP (red) or control (grey) conditions. Elevated IOP significantly reduced responses to spot sizes below 600 microns. E. Mean normalized responses of a single OFF-S RGC to spots of increasing size (left). Spot size response function was fit (smooth line) and the spot size that produced a half maximal response (dashed lines) was calculated. Half maximal responses for a population of OFF-S RGCs from control and bead-injected Il1a−/−Tnf−/− C1qa−/− mice (right). The spots size that produced a half-maximal response was significantly larger in bead-injected mice. All quantification performed on mice with sustained increases in IOP. * P < 0.05, unpaired t-test or one-way ANOVA as appropriate. Individual data points are plotted and represent individual cells from 4 animals (control) and 9 animals (bead-injected), while bars represent mean ± s.e.m.

