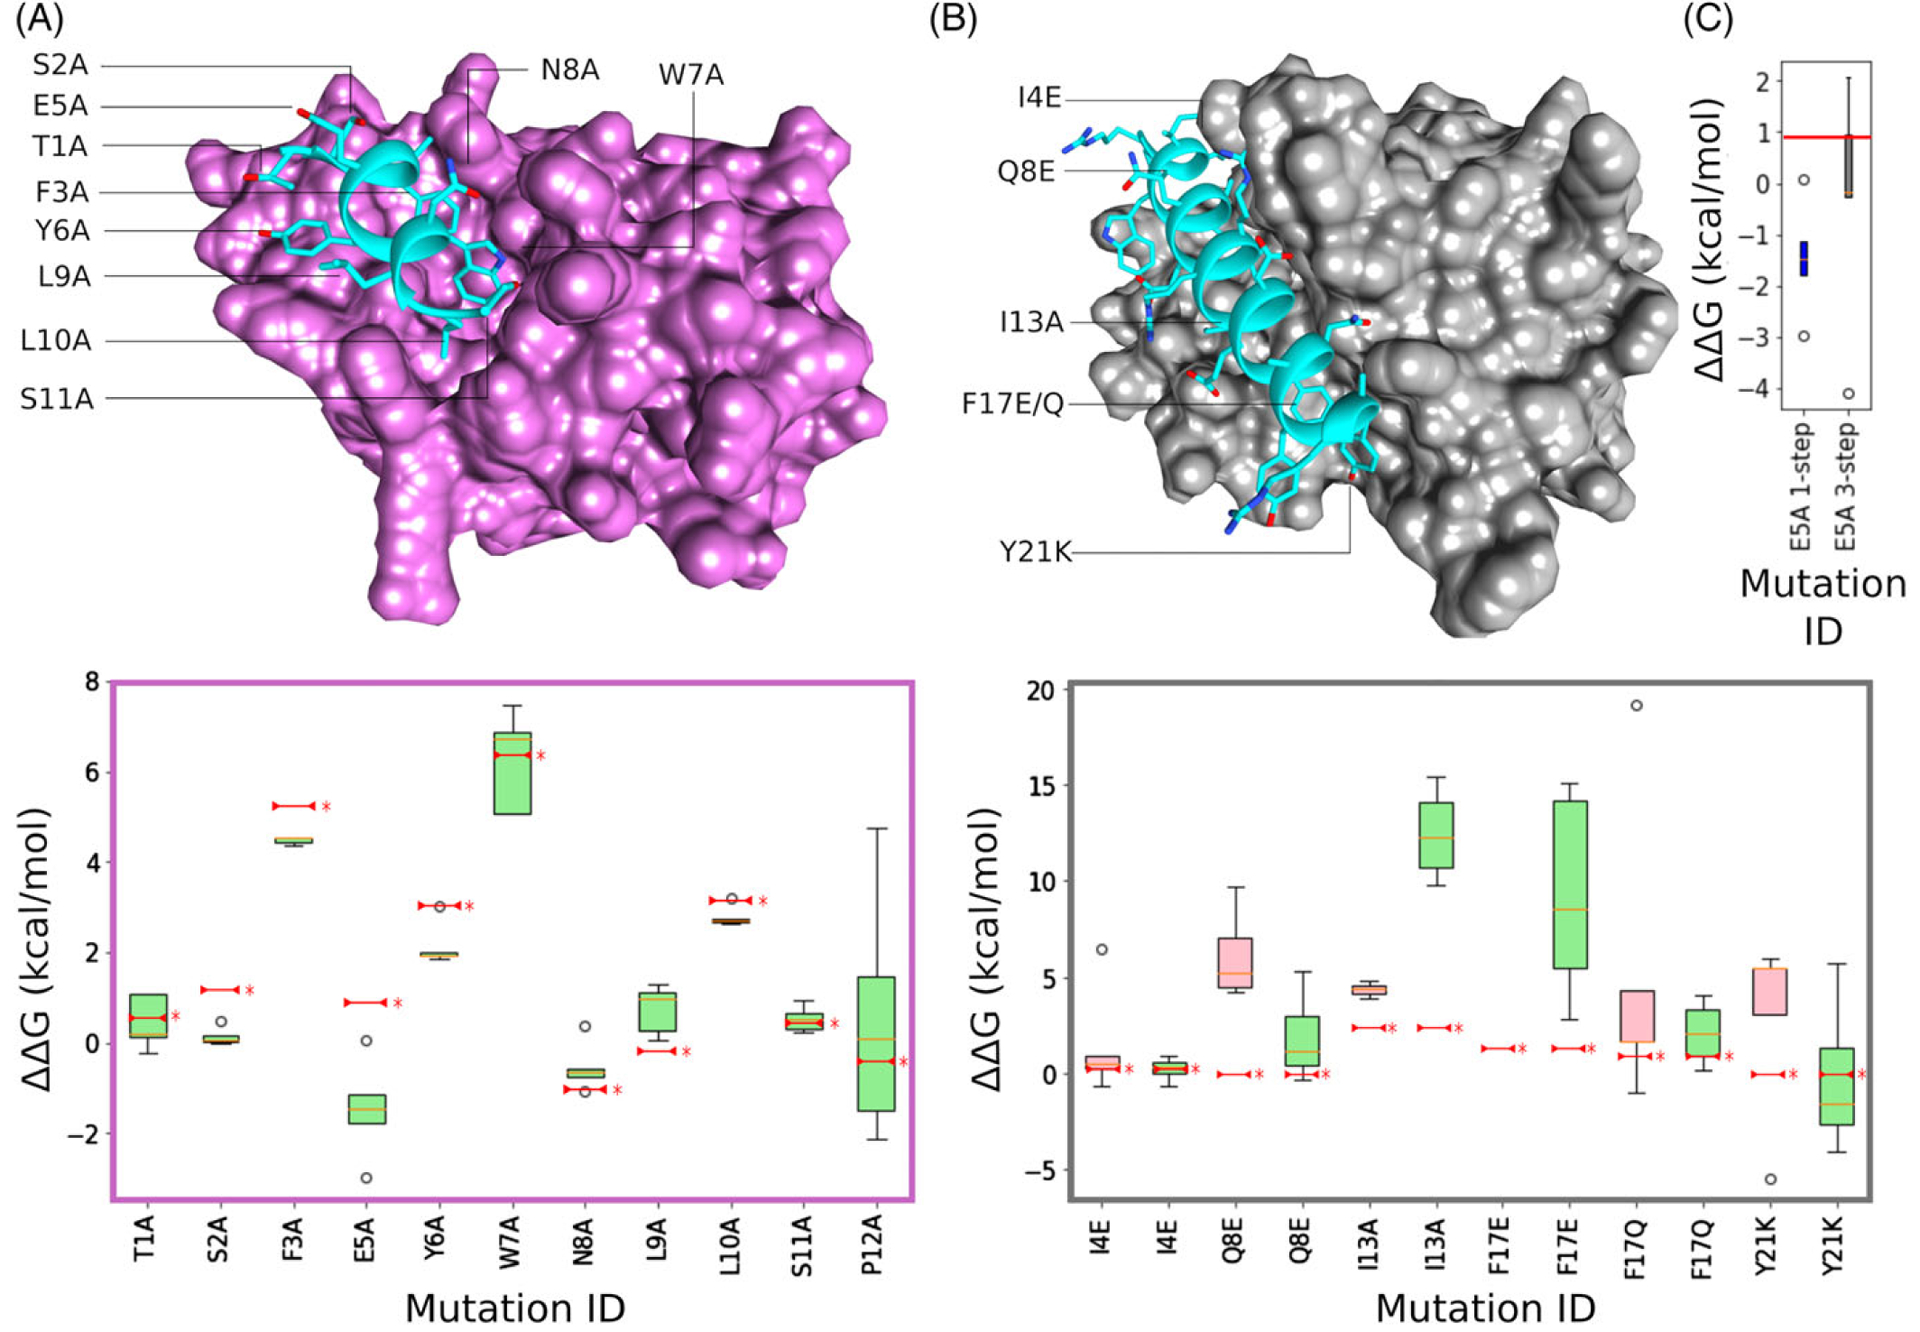
FIGURE 2.

Atomistic structures and TI binding energy change box plots for benchmarking cases MDM2–PMI and MCL2–Bim. (A) PMI peptide (blue) in complex with MDM2 (pink). Box plot below structure shows changing binding energy for each mutation with five TI replicates in each distribution. Published experimental values are marked by a red line and *. (B) Bim peptide (blue) in complex with MCL2 (gray). Associated box plot below shows distributions for both 1-step (red) and 3-step (green) protocols. (C) Box plot showing improved TI prediction using 3-step protocol for MDM3–PMI E5A mutation (red line = published experimental value)
