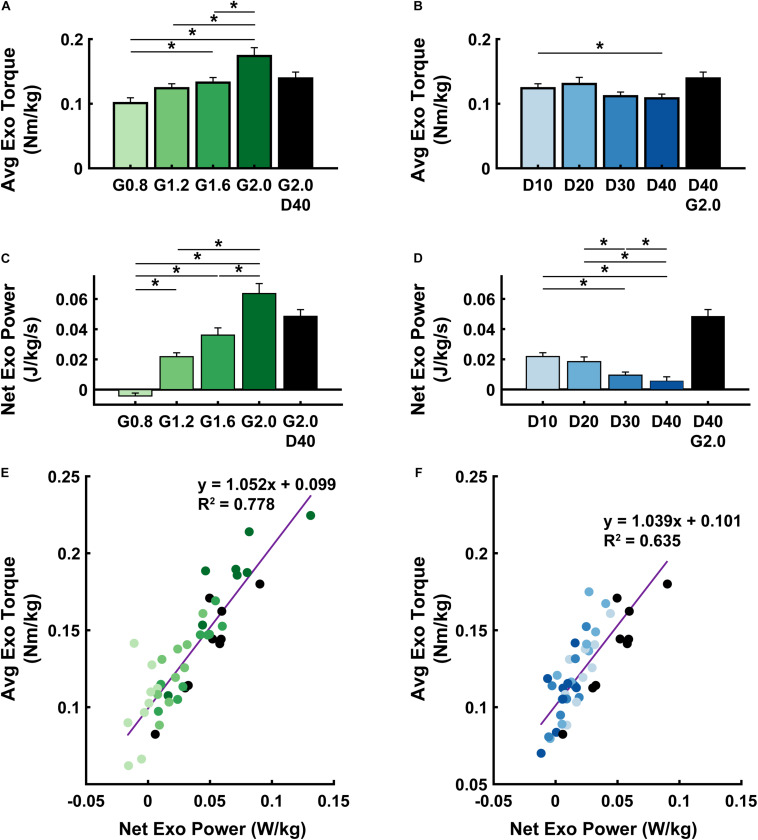
FIGURE 3.
Exoskeleton mechanics. Average (± S.E.M., N = 9 participants) exoskeleton torque (A,B), net exoskeleton power (C,D), and a linear regression between the two (E,F) across NMM controller reflex Gain (green) (A,C,E) and Delay (blue) (B,D,F) conditions. * denotes pairwise significant difference with p < 0.05. R2 values are denoted with a “∼” if the linear regression was not statistically significant. Conditions are abbreviated and color coded as follows: NMM reflex Gains of 0.8, 1.2, 1.6, and 2.0 all with reflex Delay = 10 ms (G0.8, G1.2, G1.6, and G2.0, respectively) (green), NMM reflex Delays of 10, 20, 30, and 40 ms all with a reflex Gain = 1.2 (D10, D20, D30, D40, respectively) (blue), and a high-Gain-high-Delay condition (G2.0 D40) (black).

