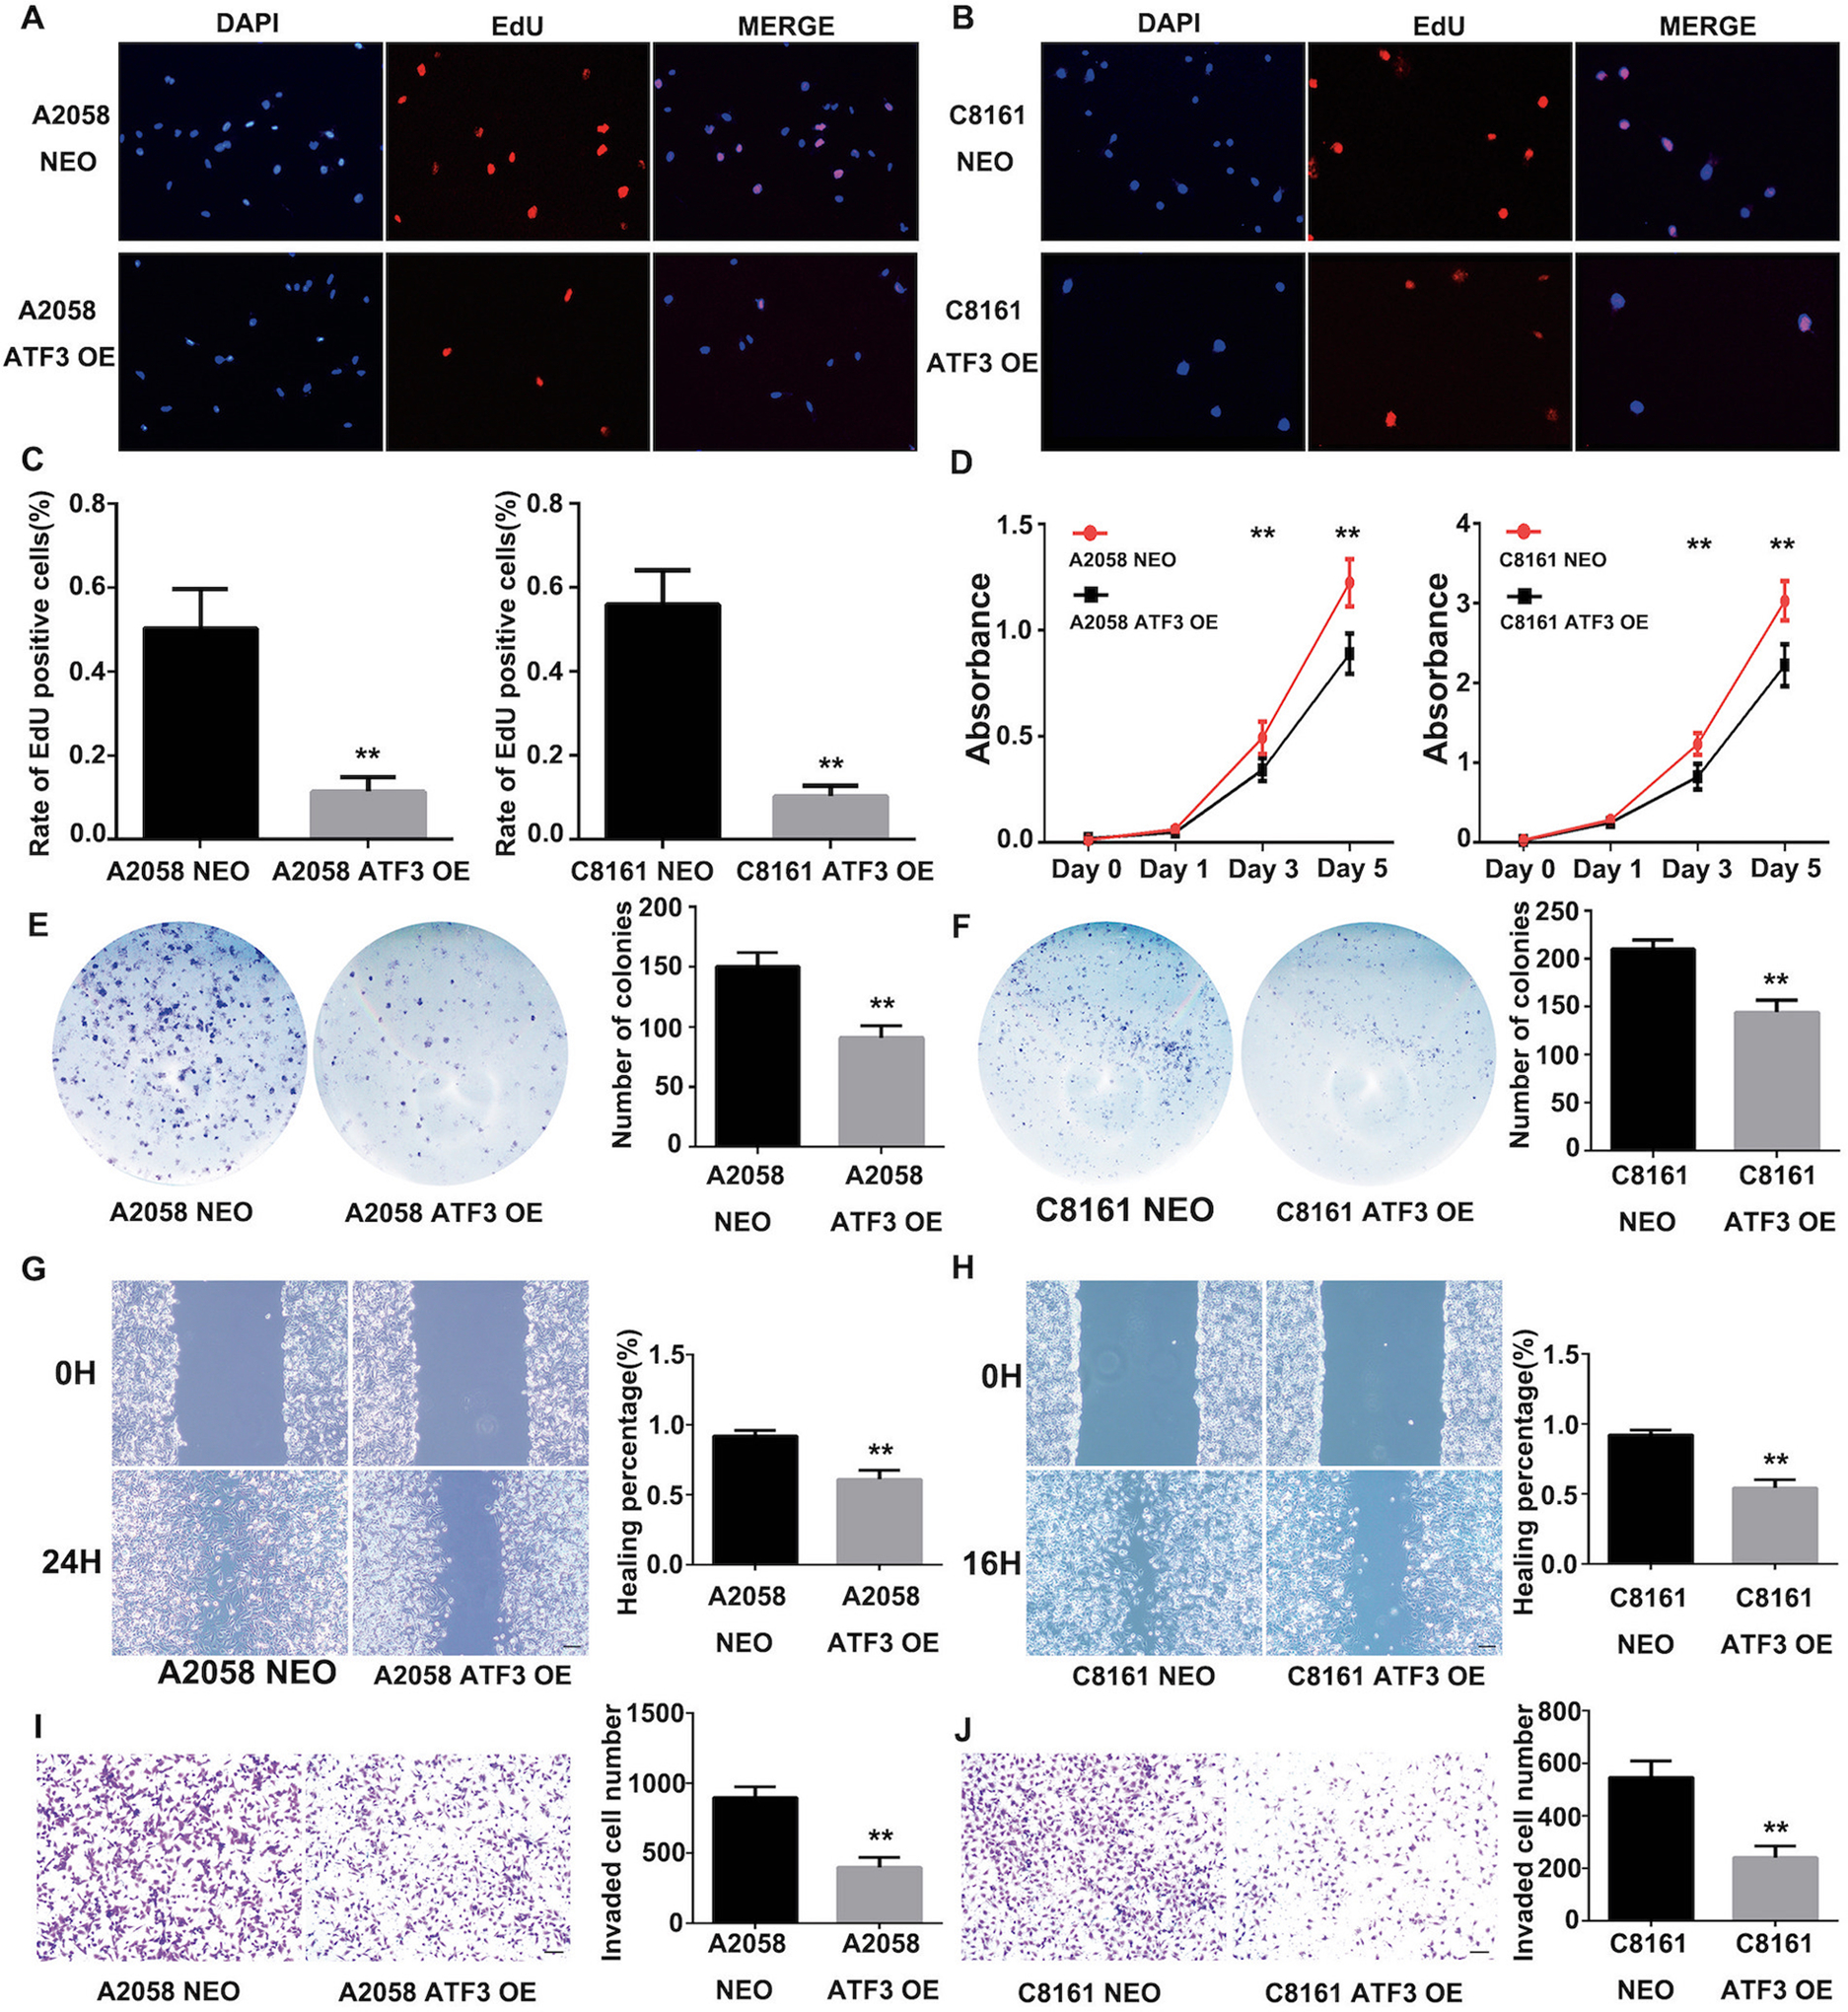
Figure 2. ATF3 over-expression inhibited melanoma cell growth, migration and invasion.

(A), (B) and (C) EdU incorporation assay in A2058 and C8161 ATF3 overexpression cell lines. The nuclei of EdU-positive cells were labeled red and cell nuclei were labeled blue with DAPI. The column summarized the staining scores of EdU-positive cells. Scale bar represent 100μm. (D) CCK-8 assay in A2058 and C8161 ATF3 overexpression cell lines. (E) and (F) Cell colony assay in A2058 and C8161 ATF3 overexpression cell lines. The column summarized the colonies of the cells. (G) and (H) Wound healing assay in A2058 and C8161 ATF3 overexpression cell lines. The column summarized the healing percentages compared with NEO control group. Scale bar represent 100μm. (I) and (J) Transwell assay for A2058 and C8161 ATF3 overexpression cell lines invasion tests. The column summarized the invaded cells. Scale bar represent 100μm. Data are presented as the mean ± standard deviation, **P < 0.01.
