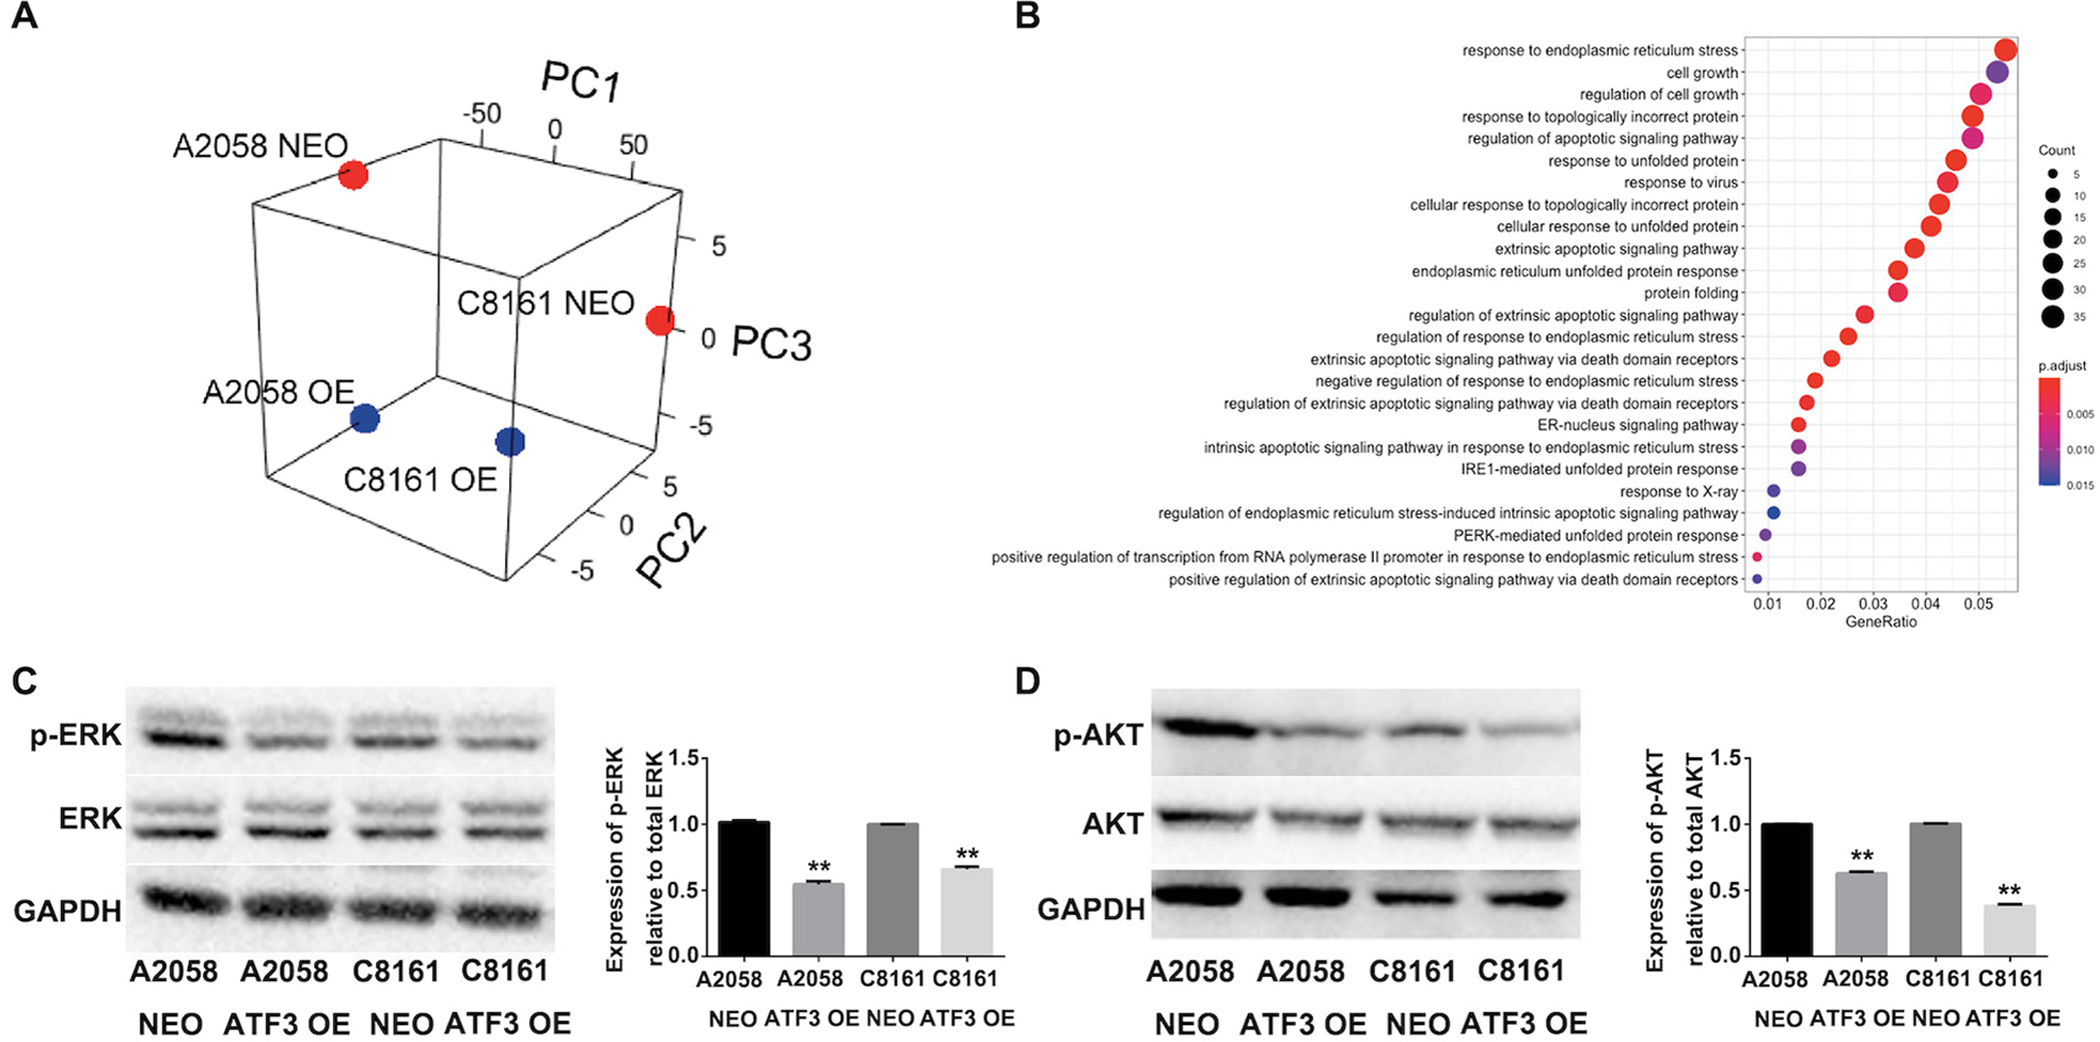
Figure 4. ATF3 over-expression inhibits melanoma cell growth, migration and invasion by down regulating ERK and AKT phosphorylation.

(A) PCA of all genes detected by RNA-seq of A2058 and C8161 ATF-3 overexpressing (OE) and neomycin control (NEO) cell lines. (n=2). (B) Dot plot of enriched GO terms. The 25 GO processes with the largest gene ratios are shown in order of gene ratio. Dot size represents the number of genes with increased expression in C8161 ATF3 OE cells compared to NEO associated with that GO term. Dot color indicates the FDR-adjusted p-value. (C) and (D) Total and phosphorylation level of ERK, and AKT changes in A2058 and C8161 NEO control and ATF3 overexpressed cell lines. The column summarized the protein phosphorylation level in melanoma cells, which normalized to total protein respectively. Data are presented as the mean ± standard deviation, **P < 0.01.
