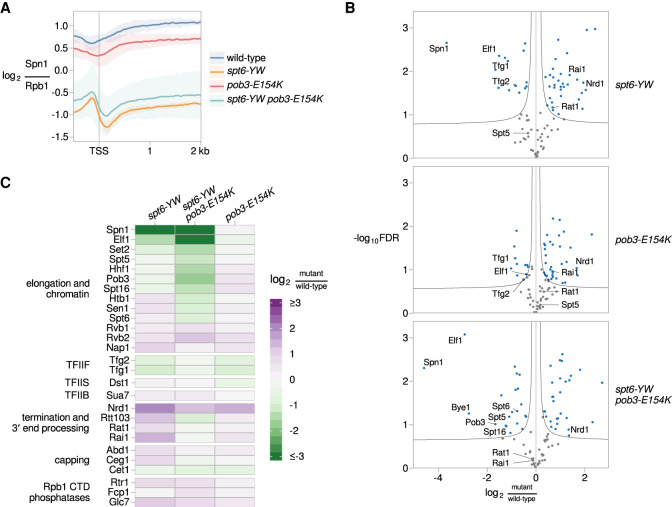
Figure 5.
Suppression by pob3-E154K does not restore the loss of Spn1 recruitment in an spt6-YW mutant. (A) The average Rpb1-normalized Spn1 ChIP enrichment over 3087 nonoverlapping verified coding genes aligned by TSS in wild type (FY3292), spt6-YW (FY3289), pob3-E154K (FY3294), and spt6-YW pob3-E154K (FY3293). The solid line and shading are the mean and 95% confidence interval of the mean ratio over the genes considered from two replicates. (B) Volcano plots comparing the Rpb3-FLAG interactome in spt6-YW, pob3-E154K, and spt6-YW pob3-E154K versus wild type, as measured by mass spectrometry. Fold changes and significance values are calculated from significance analysis of microarrays (Tusher et al. 2001), using either two (wild type, pob3-E154K, and spt6-YW pob3-E154K) or three (spt6-YW) replicates. Black lines indicate significance cutoffs at an FDR of 0.1 and s0 of 0.1. Each point is an Rpb3-interacting protein enriched in Rpb3-FLAG IP samples over untagged mock IP samples, with blue points indicating proteins significantly changed between strains. (C) A heat map of the ratio of mass spectrometry signal in spt6-YW, spt6-YW pob3-E154K, and pob3-E154K versus wild type, for selected RNAPII-interacting factors.

