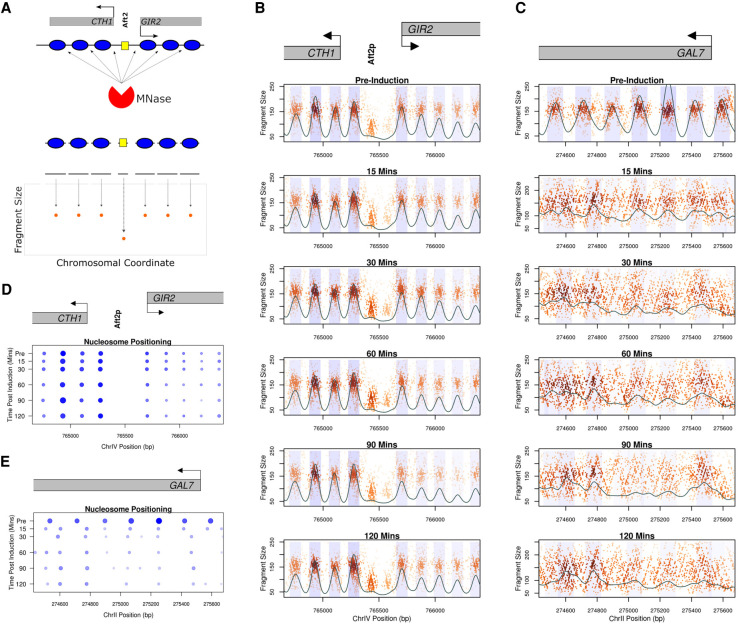
Figure 2.
Genome-wide chromatin occupancy profiles (GCOPs) to detect chromatin changes at base-pair resolution. (A) Schematic of the MNase-seq based assay to generate GCOPs. MNase digests unprotected DNA, the subsequent nucleosome and TF protected fragments of DNA are subjected to paired-end sequencing, and the fragment size is plotted as a function of the position of its midpoint along the chromosome. (B) GCOP for the CTH1 and GIR2 loci which serve as a control for unaltered chromatin. Gray boxes depict gene bodies, with arrows indicating the direction of transcription. The Aft2p binding site is annotated between these two genes. A two-dimensional (2D) cross correlation with an idealized nucleosome (see Methods) is calculated at every base pair and depicted as a continuous black trace. The peaks of this cross-correlation analysis represent the most likely position of a locally detected nucleosome, and the shaded regions represent 0.5 standard deviations of nucleosome positions from the center of each detected peak. The intensity of the shaded color is proportional to the nucleosome's peak cross-correlation score. (C) GCOP for the GAL7 locus following galactose induction. (D) and (E) serve as pictographic summaries of the chromatin changes observed, where each blue circle represents a corresponding nucleosome from the plots in B and C. The size of a given circle is proportional to its occupancy; its x position is the location of the peak of the 2D cross-correlation score, and the intensity of color is proportional to the peak cross-correlation value (fuzziness).

