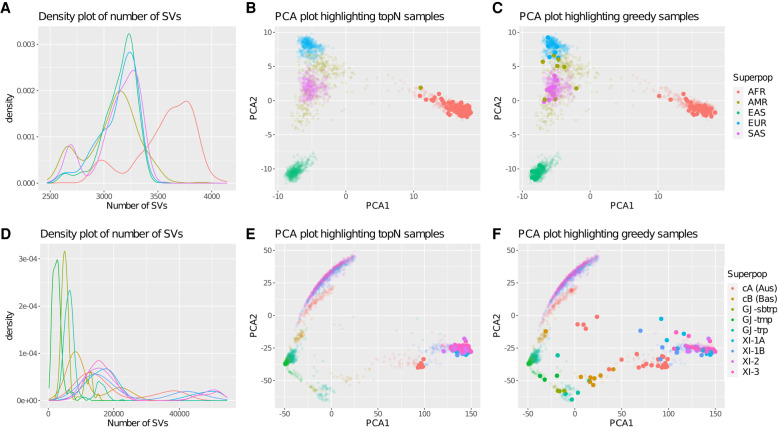
Figure 2.
Density and PCA plots of the 1000 Genomes Project and the 3000 Rice Genomes Project. (A) Density plot of the number of SVs reported per person for each of the five superpopulations in the 1000 Genomes Project. The variants include all nonreference alleles, with both homozygous and heterozygous variants considered equally. The peak for the African (AFR) superpopulation occurs around 3750 SVs per person, whereas the peaks for the other superpopulations occur around 3250 SVs per person. (B,C) PCA plots of the 1000 Genome Project samples colored by superpopulation highlighting the 100 most diverse samples chosen by the topN or greedy approaches, respectively. The topN method oversamples from superpopulations with a greater number of SVs, whereas the greedy method picks a representative sampling across all the superpopulations. (D) Density plot of the number of SVs per sample for each of the nine populations in the 3000 Rice Genomes Project. (E,F) PCA plots of the 3000 Rice Genome Project samples constructed by using variants with an allele frequency >5%. The PCA plots are colored by population and highlight the 100 most diverse samples chosen by the topN or greedy approaches, respectively. The topN method oversamples from populations with a greater number of SVs, whereas the greedy method picks a representative sampling across all the populations.

