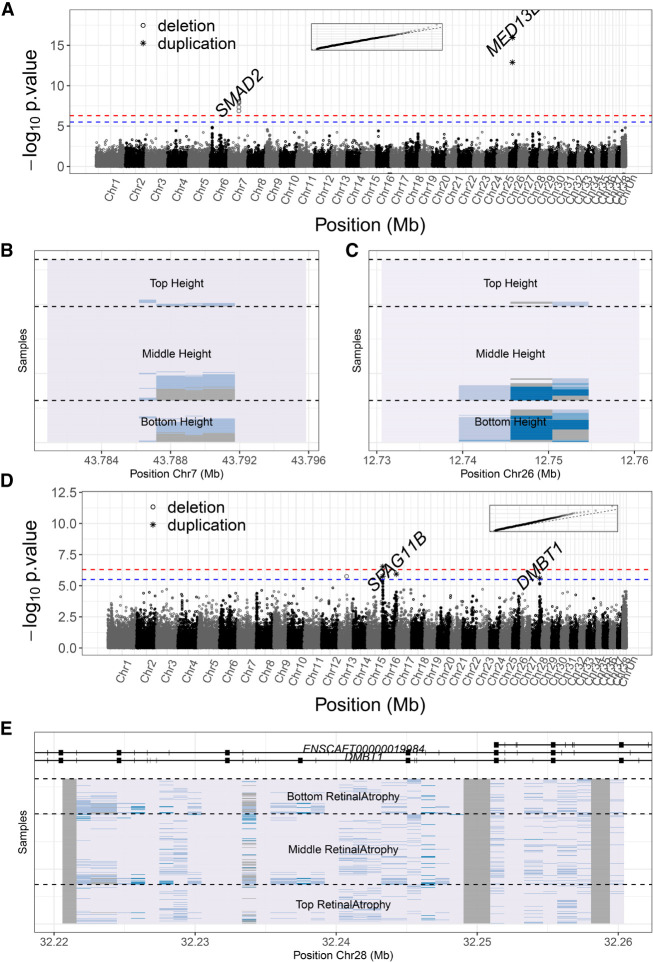
Figure 2.
Analysis of the associations between CNVs and two phenotypes. (A,D) Manhattan plots of the copy number GWAS for breed standard height, retinal atrophy susceptibility, respectively (Jones et al. 2008). Red line: Bonferroni correction (−log10P-value = 6.417). Blue line: one order of magnitude below Bonferroni correction (−log10P-value = 5.417). P-values were calculated using different tests (Supplemental Table S3 and Methods). (B,C,E) Close-up of the relevant regions for each trait, respectively: SMAD2 (Chr 7: 43,787,168–43,801,320) and MED13L (Chr 26: 12,739,546–12,754,676) loci for height, and DMBT1 (Chr 28: 32,220,591–32,260,415) for retinal atrophy. Each sample corresponds to a line along the y-axis and is ordered according to the trait in question. The x-axis shows the genomic position of each window. CN windows for each sample are colored according to their normalized distance to the median CN in the window; the darker the shade of blue, the more the CN of a sample differs from the window median. Gray CN windows correspond to uncertain genotypes.

