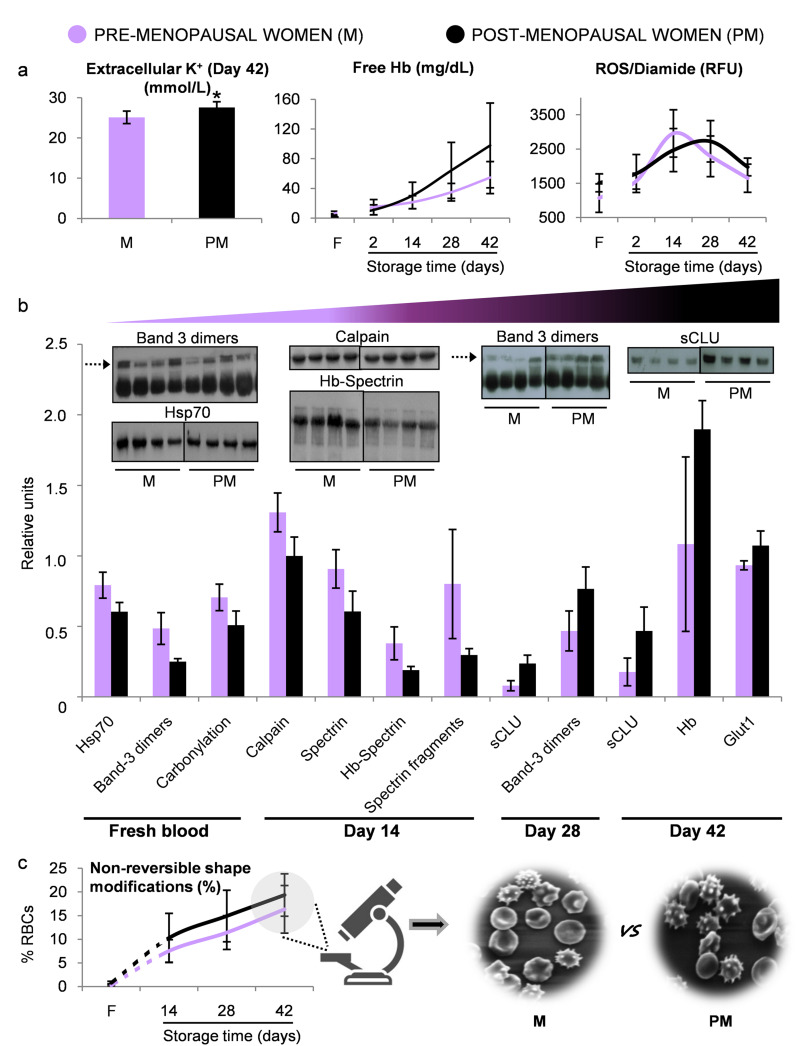
Figure 5.
Biological evaluation of pre- vs post-menopausal women
(A) Variables showing a trend for different levels between the two groups. (B) Statistically significant differences (p<0.05) in the levels of red blood cell (RBC) membrane proteins (inserts: representative immunoblotting images, dashed arrows: band 3 dimers). (C) Morphological analysis using scanning electron microscopy (magnification ×1,000). *p<0.05 pre- (M) vs post- (PM) menopausal female donors. F: fresh blood. Error bars: ±standard deviation (SD).

