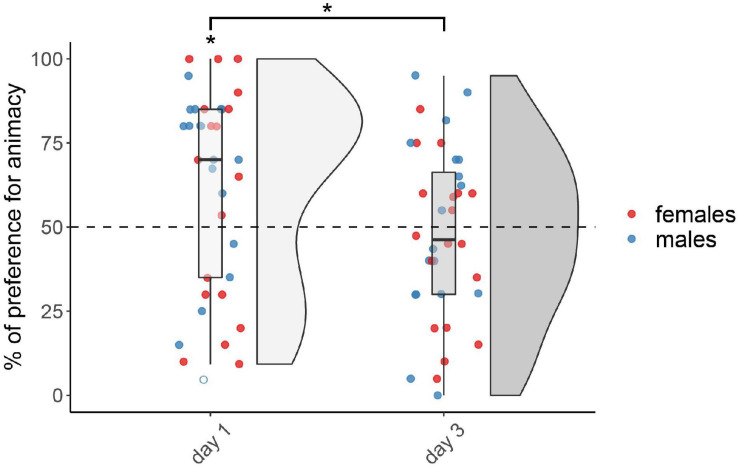
FIGURE 1.
Preference for animacy for the not-injected chicks tested 1 or 3 days after hatching. To best represent the data, we used raincloud plots. Asterisks indicate significant differences from chance (black dotted line). Black asterisk between the two groups indicates a significant difference between testing Days. * indicates p < 0.05. Filled red dots represent female and blue male subjects, empty dots represent outliers, which were removed from the analyses.

