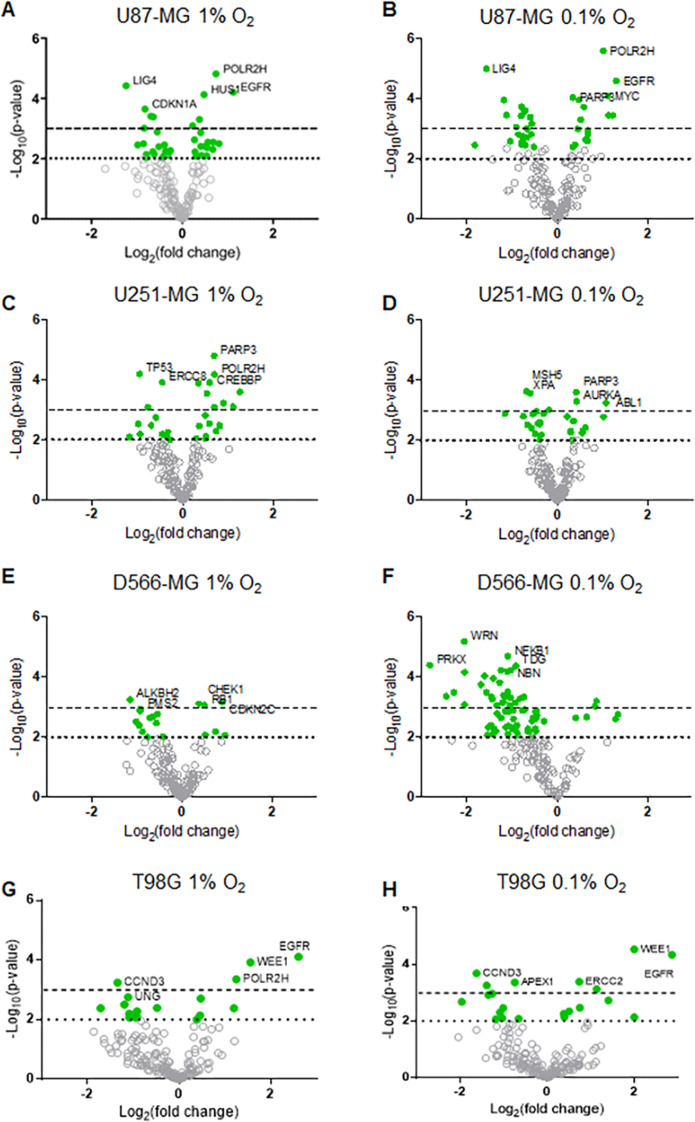
Figure 2. DNA repair gene regulation by hypoxia is observed across all GBM cell lines.
Gene expression data for (A–B) U87-MG, (C–D) U251-MG, (E–F) D566-MG and (G–H) T98G in 1% or 0.1% O2 is represented as log2 fold change with respect to 21% O2 for each gene, plotted with log10 p-value. Each point represents the average of three experimental replicates. Green filled circles signify genes that have a p-value below the p < 0.01 threshold (dotted line). Dashed line is at p = 0.001. Grey hollow circles represent non-statistically significant genes. The top five statistically significant genes are identified with the gene name.

