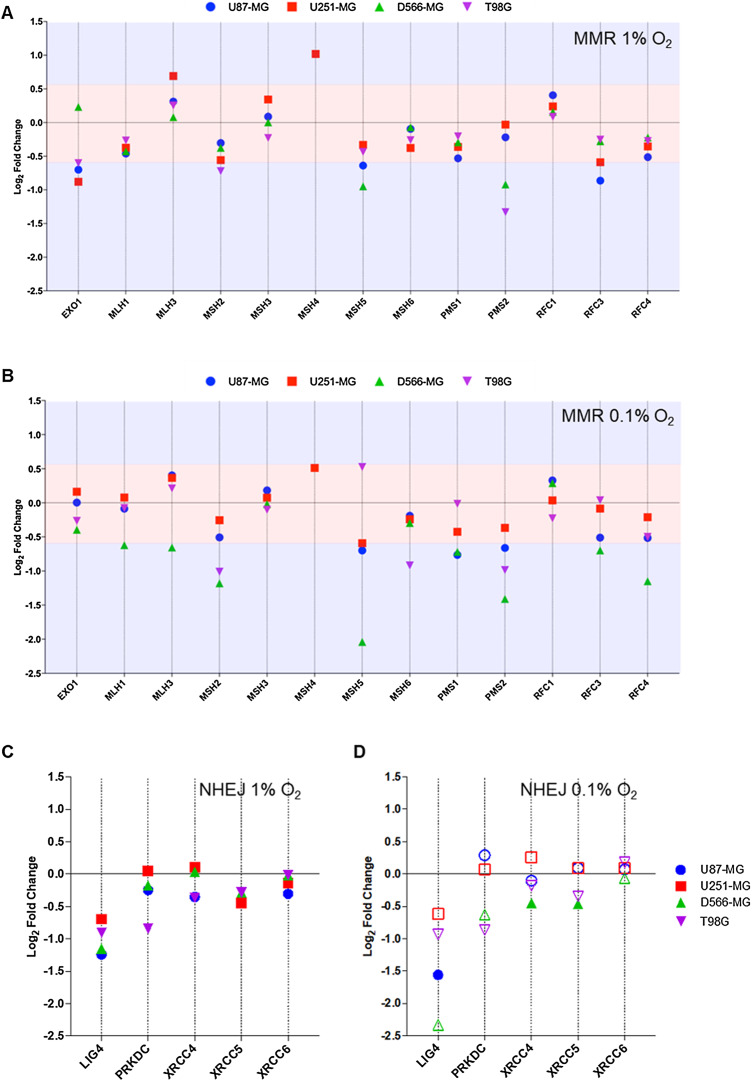
Figure 3. PMS2 and LIG4, essential components of MMR and NHEJ are downregulated in multiple cell lines.
Differential gene expression was calculated for each gene as log2 fold change for (A) MMR genes in 1% O2, (B) MMR genes in 0.1% O2, (C) NHEJ genes in 1% O2, and (D) NHEJ in 0.1% O2, with respect to the expression level at 21% O2. Red shaded area denotes fold change values below the +/−0.58log2fold (+/−1.5-fold) threshold of change. Blue area denotes fold change values above the designated threshold. Filled shapes represent data which is statistically significant (p < 0.01), whereas hollow shapes show no statistical significance. Data are represented as the mean of three independent experiments.

