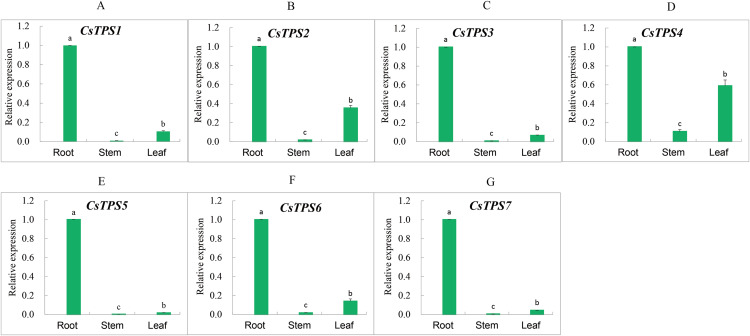
Figure 7. Expression levels of CsTPS genes in root, stem and leaf.
The expression patterns of CsTPS1–CsTPS7 in different tissues are shown in A–G, respectively. Error bars represent the standard error of three replicates. The relative expression of each gene in different tissues is expressed as mean ± SE (n = 3). Bars with different lowercase letters were significantly different by Duncan’s multiple range tests (p < 0.05).

