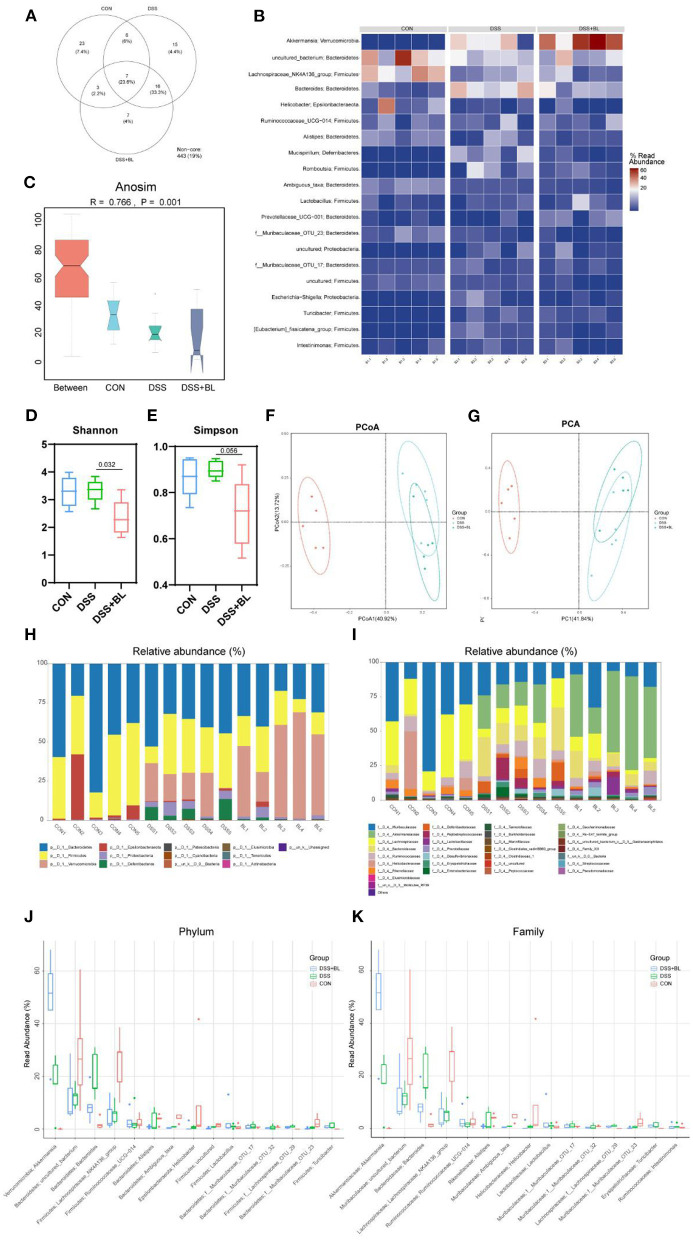
Figure 5.
Effects of bovine lactoferrin (BL) on gut microbial structure in dextran sulfate sodium salt (DSS) mice. (A) Venn diagram of colony structure. (B) Top 20 intestinal flora in each group. (C) Anosim analysis. (D) Shannon analysis of intestinal flora. (E) Simpson analysis of intestinal flora. (F) Principal coordinate analysis (PCoA) of intestinal flora. (G) Principal component analysis (PCA) of intestinal flora. (H,J) The expression of phylum relative abundance. (I,K) The expression of family relative abundance. One-way ANOVA was used to compare the three groups. *P < 0.05 vs. control; #P < 0.05 vs. DSS.

